
Digite qualquer função e veja o formato dela na hora. Trace até três de uma vez em três cores para compará-las, arraste o ponto de leitura para ler um valor da curva e veja onde cada uma cruza o zero.
—
O KiwiBee usa cookies opcionais do Google Analytics, Google Ads e Meta Pixel para entender os visitantes adultos, medir cadastros concluídos e melhorar as campanhas. Os cookies essenciais ficam sempre ativos. O Pixel de anúncios do ChatGPT da OpenAI também mede visitas e consultas enviadas após o consentimento publicitário e pode usar dados de contato com hash para correspondência. Política de privacidade
[Pt] Monte Carlo & Buffon's Needle demonstrates how randomness can solve deterministic geometric problems. In Sphere in Cube (3D) mode, random points (x, y, z) rain into a cube of side 2R; because the inscribed sphere occupies exactly π/6 ≈ 52.36% of the cube's volume, multiplying the fraction of gold inside hits by 6 estimates π. Students can also switch to the classic 2D Circle in Square ratio (π/4) or Buffon's Needles, where sticks of length L dropped onto floorboards spaced D apart cross a line with probability 2L/(πD). Dragging the overhead emitter or firing 500-sample bursts drives the live convergence curve toward 3.14159 by the Law of Large Numbers.
[Pt] A cube extending from −R to +R has side length 2R and volume (2R)³ = 8R³. A sphere of radius R inscribed inside it has volume (4/3)πR³. Dividing the sphere volume by the cube volume cancels R³ and gives (4/3)π / 8 = π / 6, so π = 6 × (V_sphere / V_cube).
[Pt] In 1777 Georges-Louis Leclerc, Comte de Buffon showed that when a needle of length L (with L ≤ D) is dropped randomly onto parallel lines spaced D apart, the probability of crossing a line is P = 2L / (πD). Rearranging gives π ≈ 2L·N / (D·K).
[Pt] Random sampling has standard error proportional to 1/√N. With only 50 darts, a few lucky or unlucky hits shift the ratio by several percent; reducing the error by a factor of 10 requires 100 times as many samples.
[Pt] Monte Carlo simulations are essential in high-dimensional physics, radiation transport, financial risk modeling, computer graphics ray tracing, and AI tree search where exact integrals have too many dimensions to solve on a grid.
Coloque no seu AVA, blog ou site da turma — de graça.
<iframe src="https://kiwibee.io/pt/simulations/monte-carlo-probability-pi-3d-3d-simulation/embed" title="Monte Carlo & Buffon's Needle | KiwiBee" loading="lazy" allowfullscreen style="width:100%;height:min(70vh,620px);min-height:420px;border:0;border-radius:16px"></iframe>Continue explorando
Digite qualquer função e veja o formato dela na hora. Trace até três de uma vez em três cores para compará-las, arraste o ponto de leitura para ler um valor da curva e veja onde cada uma cruza o zero.

Gire uma roleta, jogue uma moeda ou role um dado e veja dois conjuntos de barras: as chances que os formatos preveem e os resultados que você realmente obteve. Dez giros não provam nada; com algumas centenas, os dois quase não se distinguem.

Mova m e veja a reta inclinar; mova b e veja a reta deslizar. Ou arraste os dois pontos da reta e leia a equação que ela devolve. Uma escada de “subida sobre avanço” sobe pela reta para que o coeficiente angular vire algo que dá para contar.
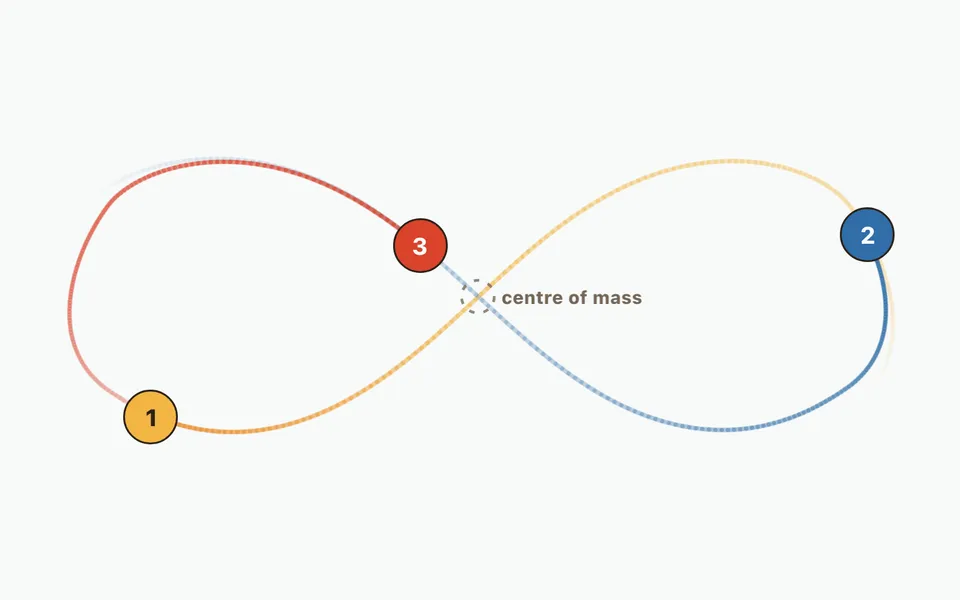
Compare uma órbita de dois corpos com o movimento em oito de três corpos e adicione até doze corpos. Altere massas, velocidades e posições iniciais; observe trajetórias e erro numérico de energia.

Aproxime a área sob uma curva com faixas e escolha como cada uma toma a altura: borda esquerda, borda direita, meio ou topo inclinado. Aumente o número de faixas e veja o erro cair, com a soma acumulada traçada como uma curva própria.
Do modelo ao registro
Use uma atividade para registrar previsões, observações e explicações depois que os alunos explorarem.
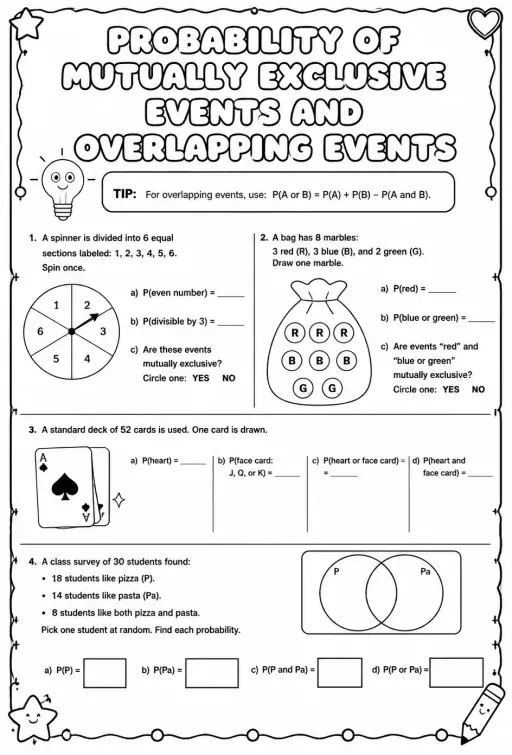
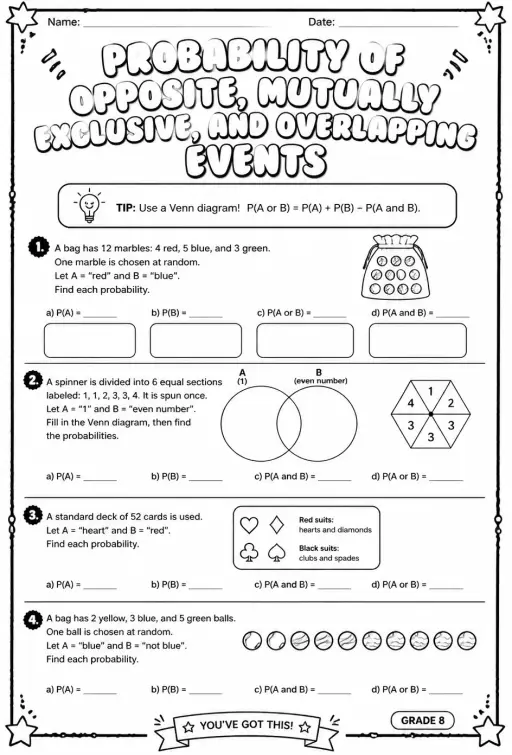
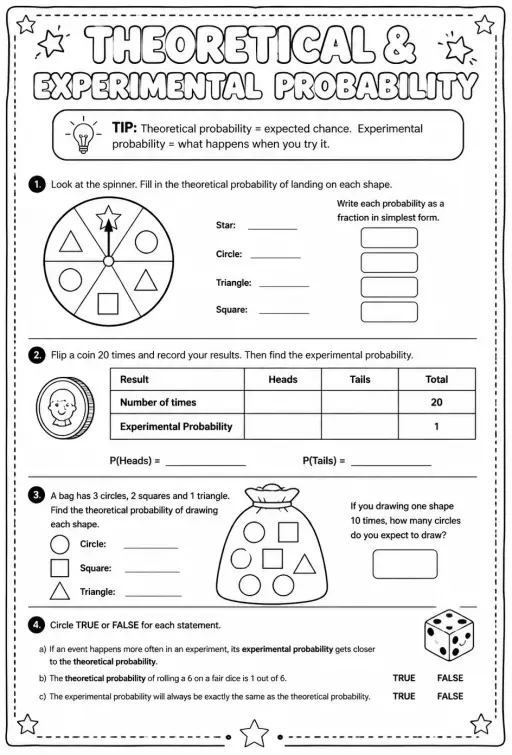
O espaço gratuito do professor da KiwiBee reúne em um só lugar o planejamento de aulas, as atividades, as ferramentas de sala e o diário de classe.
Comece grátis e crie sua primeira turma Início
 Todas as soluções
 Preços
 Sobre nós
 KiwiBee para organizações sem fins lucrativos
 Eventos e webinars
 Para grandes redes de ensino
 Para escolas
 Para centros educacionais
 Para líderes de equipe
 Para professores
 IA e recursos
 Recursos
 Atividades para imprimir
 Pacotes de aula
 Simulações interativas
 Ferramentas para professores
 Estúdio de IA
 Ideias e pesquisa