
Approximate the area under a curve with strips and choose how each takes its height: left edge, right edge, middle, or a sloping top. Push the strip count up and watch the error fall, with the running total plotted as its own curve.
—
KiwiBee بالغ وزیٹرز کو سمجھنے، مکمل ہونے والے سائن اپس کی پیمائش کرنے اور مہمات کو بہتر بنانے کے لیے Google Analytics، Google Ads اور Meta Pixel کی اختیاری کوکیز استعمال کرتا ہے۔ ضروری کوکیز ہمیشہ فعال رہتی ہیں۔ OpenAI کا ChatGPT Ads Pixel اشتہارات کی رضامندی کے بعد صفحات کے مشاہدات اور بھیجی گئی درخواستیں بھی ناپتا ہے اور مماثلت کے لیے ہیش کی گئی رابطہ معلومات استعمال کر سکتا ہے۔ رازداری کی پالیسی
Riemann Sums & 3D Integrals turns multivariable integration into a tactile 3D geometry model. Students see a translucent curved surface z = f(x, y) hovering over a subdivided xy-domain filled with height-colored rectangular columns. Each column has base area Δx·Δy and height f(xᵢ*, yⱼ*) sampled according to the selected rule. Dragging the glowing probe across the surface highlights the active prism and displays its individual volume dV = f(x, y) Δx Δy, while dragging the corner boundary handle resizes the integration domain. By sliding the grid resolution N from coarse blocks up to a 20×20 mesh of 400 columns across Paraboloid Dome, Saddle Wave, and Gaussian Hill surfaces, learners observe how the double sum converges to the exact analytical double integral.
A 3D Riemann sum divides a two-dimensional region R in the xy-plane into small rectangles of area ΔA = Δx·Δy. Above each rectangle, a vertical prism is built up to the surface height f(xᵢ*, yⱼ*). Adding the volumes of all N² prisms approximates the exact double integral.
In the Midpoint rule, the prism height is evaluated at the center of each sub-rectangle. For a sloped surface, the part of the surface rising above the flat prism top on one side nearly cancels the part dipping below it on the opposite side, reducing error to O(1/N²).
As N increases, the base dimensions Δx and Δy become smaller while the number of columns grows as N². The stepped tops of the prisms fit the smooth surface ever more tightly, and in the limit N → ∞ the Riemann sum equals the exact double integral.
Click any rectangular column or drag the glowing red probe sphere over the surface. The selected column is framed in gold and its floating label displays the exact differential volume dV = f(xᵢ*, yⱼ*) Δx Δy.
اسے اپنے ایل ایم ایس، بلاگ یا کلاس کی ویب سائٹ پر لگائیں — مفت۔
<iframe src="https://kiwibee.io/ur/simulations/riemann-sums-double-integral-3d-3d-simulation/embed" title="Riemann Sums & 3D Integrals | KiwiBee" loading="lazy" allowfullscreen style="width:100%;height:min(70vh,620px);min-height:420px;border:0;border-radius:16px"></iframe>دریافت جاری رکھیں
Approximate the area under a curve with strips and choose how each takes its height: left edge, right edge, middle, or a sloping top. Push the strip count up and watch the error fall, with the running total plotted as its own curve.

Type any function and see its shape straight away. Plot up to three at once in three colours to compare them, drag the trace point to read a value off a curve, and see where each one crosses zero.

Spin a spinner, flip a coin or roll a die and watch two sets of bars: the chances the shapes predict, and the results you actually got. Ten spins prove nothing; a few hundred and the two are hard to tell apart.

Move m and watch the line tilt; move b and watch it slide. Or drag the two points on the line and read the equation it writes back. A rise-over-run staircase climbs the line so slope becomes something you can count.
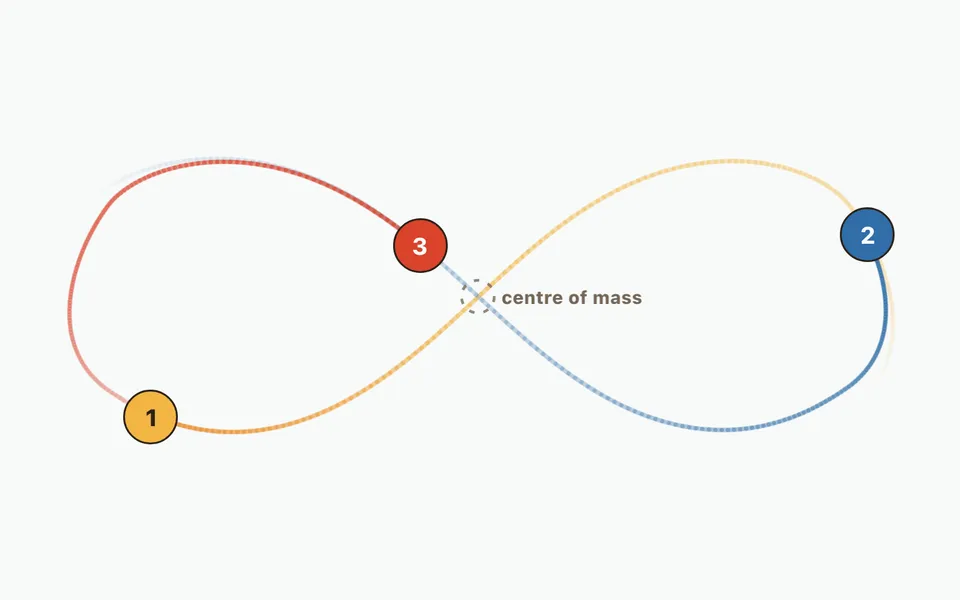
Compare a two-body orbit with three-body figure-eight motion, then add up to twelve bodies. Change initial masses, velocities and positions; watch orbit trails and numerical energy error.
ماڈل سے شواہد تک
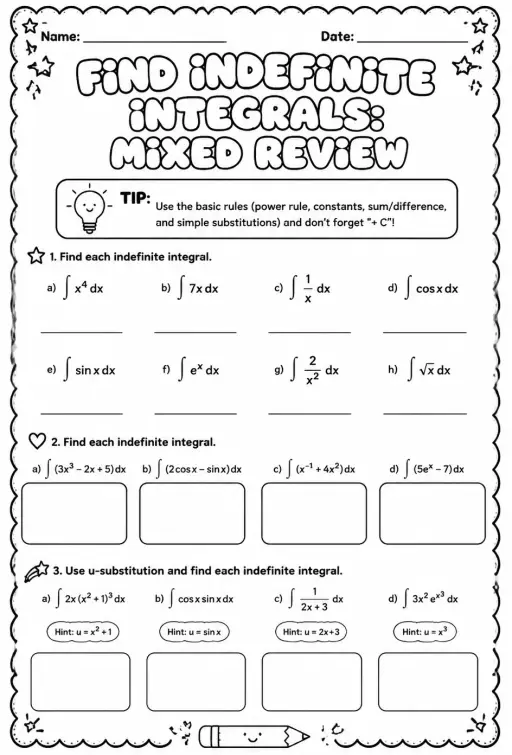
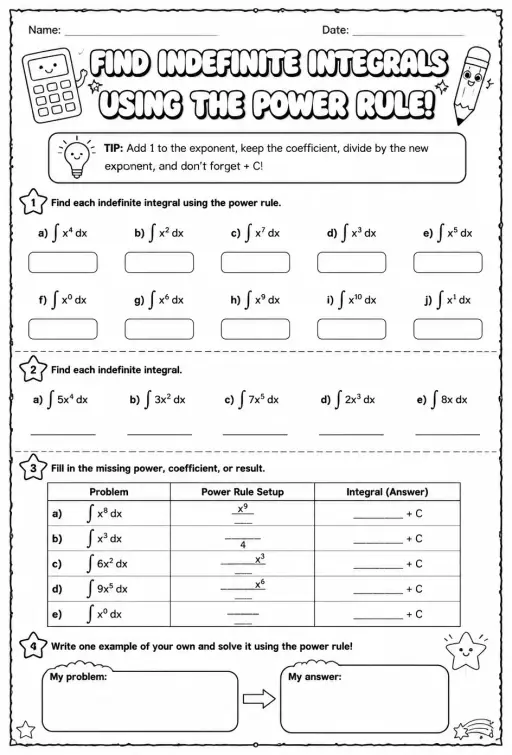
طلبہ کے دریافت کرنے کے بعد ان کے اندازے، مشاہدات اور وضاحتیں لکھوانے کے لیے ورک شیٹ استعمال کریں۔
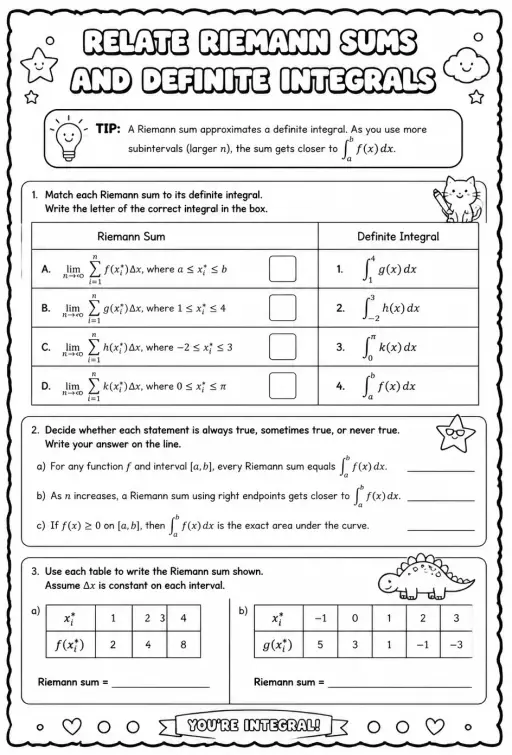
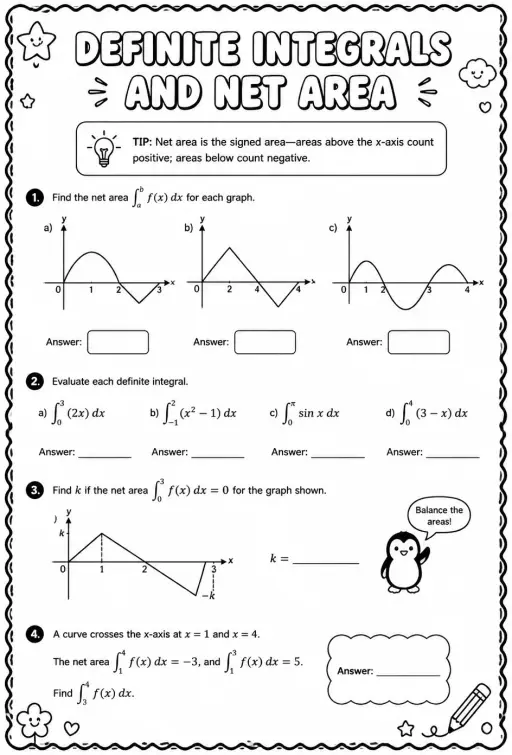
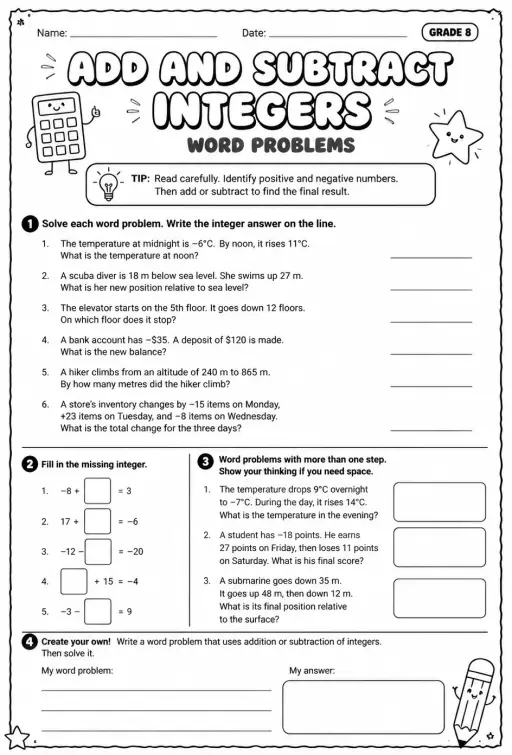
KiwiBee کا مفت اساتذہ ورک اسپیس سبق کی منصوبہ بندی، ورک شیٹس، کلاس روم اوزار اور گریڈ بک کو ایک ہی جگہ لے آتا ہے۔
مفت شروع کریں اور اپنی پہلی کلاس بنائیں ہوم
 تمام حل
 قیمتیں
 ہمارے بارے میں
 غیر منافع بخش اداروں کے لیے KiwiBee
 تقریبات اور ویبینارز
 بڑے اداروں کے لیے
 اسکولوں کے لیے
 تعلیمی مراکز کے لیے
 ٹیم لیڈرز کے لیے
 اساتذہ کے لیے
 AI اور وسائل
 وسائل
 قابلِ طباعت ورک شیٹس
 سبق پیکس
 تعاملی سمیولیشنز
 اساتذہ کے اوزار
 AI اسٹوڈیو
 خیالات اور تحقیق