
Type any function and see its shape straight away. Plot up to three at once in three colours to compare them, drag the trace point to read a value off a curve, and see where each one crosses zero.
—
KiwiBee uses optional Google Analytics, Google Ads, and Meta Pixel cookies to understand adult visitors, measure completed sign-ups, and improve campaigns. Essential cookies always stay on. OpenAI’s ChatGPT Ads Pixel also measures page views and completed enquiries after advertising consent, and may use hashed contact details for matching. Privacy policy
Draw repeated samples from uniform, skewed or two-peaked populations. Compare the population histogram with the histogram of sample means.
بله. شبیهسازی Central Limit Theorem Lab را در یک مرورگر مدرن باز کنید؛ نیازی به دانلود یا ثبتنام نیست.
این شبیهسازی تنظیمات سطح یادگیری را برای متوسطه اول و دبیرستان دربردارد. سطحی را که با کلاس شما همخوانی دارد انتخاب کنید، سپس آن را روی پروژکتور یا دستگاههای دانشآموزان استفاده کنید.
آن را در LMS، وبلاگ یا وبسایت کلاس خود قرار دهید — رایگان.
<iframe src="https://kiwibee.io/fa/simulations/central-limit-theorem-simulation/embed" title="Central Limit Theorem Lab | KiwiBee" loading="lazy" allowfullscreen style="width:100%;height:min(70vh,620px);min-height:420px;border:0;border-radius:16px"></iframe>کاوش را ادامه دهید
Type any function and see its shape straight away. Plot up to three at once in three colours to compare them, drag the trace point to read a value off a curve, and see where each one crosses zero.

Spin a spinner, flip a coin or roll a die and watch two sets of bars: the chances the shapes predict, and the results you actually got. Ten spins prove nothing; a few hundred and the two are hard to tell apart.

Move m and watch the line tilt; move b and watch it slide. Or drag the two points on the line and read the equation it writes back. A rise-over-run staircase climbs the line so slope becomes something you can count.
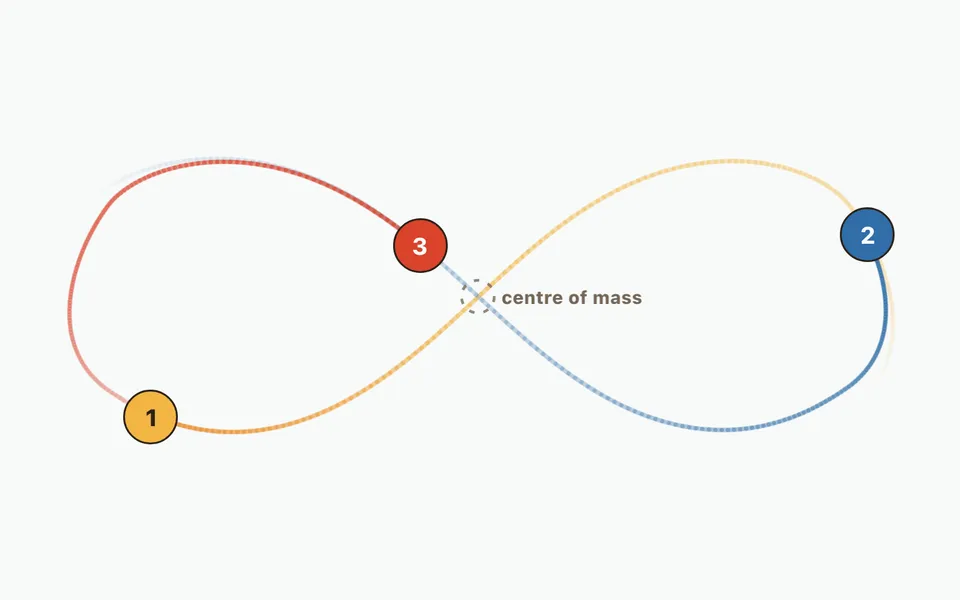
Two bodies under gravity trace an ellipse forever and you can write the formula down. Add a third and no such formula exists. Run the figure-eight orbit, nudge one mass, and watch a stable pattern become unpredictable while the total energy stays put.

Approximate the area under a curve with strips and choose how each takes its height: left edge, right edge, middle, or a sloping top. Push the strip count up and watch the error fall, with the running total plotted as its own curve.
از مدل تا شواهد
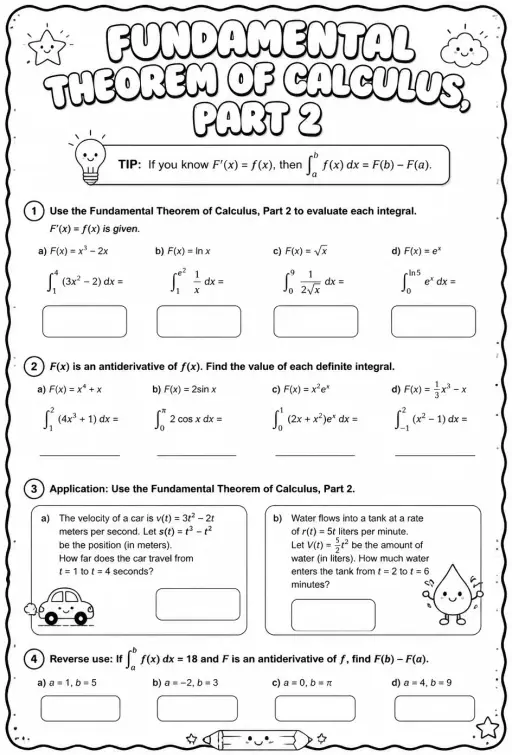
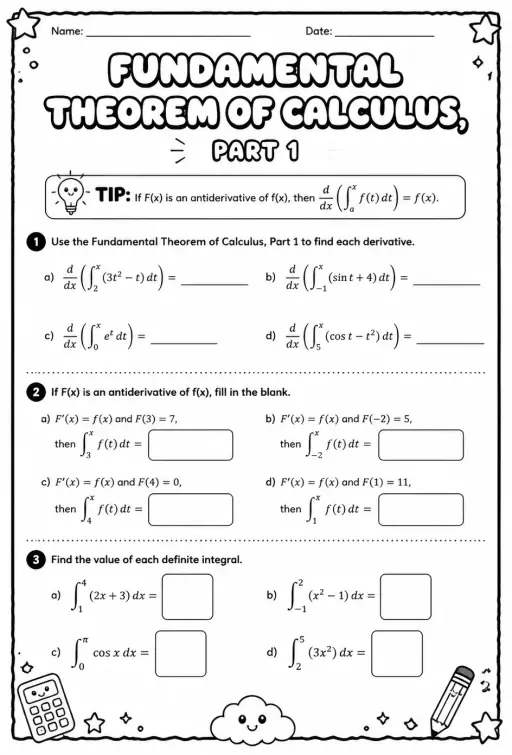
پس از کاوش دانشآموزان، از یک کاربرگ برای ثبت پیشبینیها، مشاهدات و توضیحها استفاده کنید.
فضای کاری رایگان معلمان KiwiBee برنامهریزی درس، کاربرگها، ابزارهای کلاسی و دفتر نمره را یکجا گرد هم میآورد.
رایگان شروع کنید و اولین کلاس خود را بسازید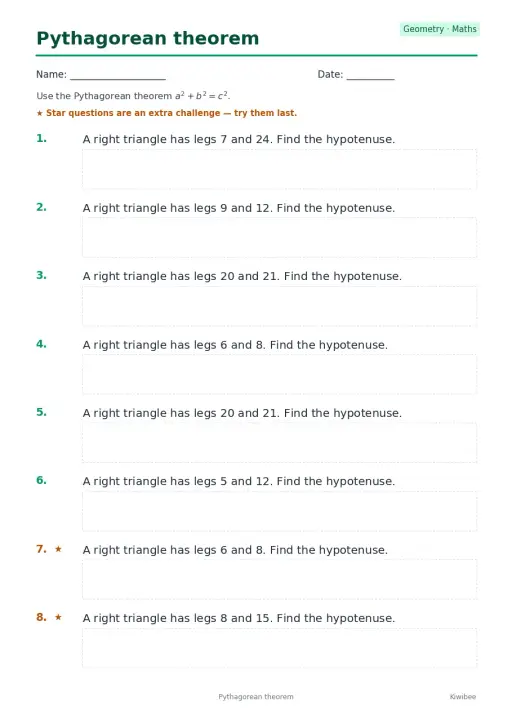
 خانه
 همهٔ راهکارها
 قیمتگذاری
 درباره ما
 KiwiBee برای سازمانهای غیرانتفاعی
 رویدادها و وبینارها
 برای سازمانهای بزرگ
 برای مدرسهها
 برای مراکز
 برای سرپرستان تیم
 برای معلمان
 هوش مصنوعی و منابع
 منابع
 کاربرگهای قابل چاپ
 بستههای درس
 شبیهسازیهای تعاملی
 ابزارهای معلم
 استودیوی هوش مصنوعی
 ایدهها و پژوهش