
Spin a spinner, flip a coin or roll a die and watch two sets of bars: the chances the shapes predict, and the results you actually got. Ten spins prove nothing; a few hundred and the two are hard to tell apart.
—
KiwiBee uses optional Google Analytics, Google Ads, and Meta Pixel cookies to understand adult visitors, measure completed sign-ups, and improve campaigns. Essential cookies always stay on. OpenAI’s ChatGPT Ads Pixel also measures page views and completed enquiries after advertising consent, and may use hashed contact details for matching. Privacy policy
A function is a rule, and its graph is the picture of that rule: every point on the curve is one input paired with the output the rule gives it. Typing the algebra and seeing the shape appear links the two directly, and changing one number at a time shows which part of the shape that number controls. Students can change x² coefficient and x coefficient and compare what happens. Use it for math inquiry with Middle School and High School on a projector or student device.
استانداردها: Common Core CCSS.MATH.CONTENT.8.F.A.3, CCSS.MATH.CONTENT.HSF.IF.C.7
Yes. Open the Function Grapher simulation in a modern browser with no download or sign-up required.
The simulation includes learning-level presets spanning Middle School and High School. Choose the level that matches your class, then use it on a projector or student devices.
آن را در LMS، وبلاگ یا وبسایت کلاس خود قرار دهید — رایگان.
<iframe src="https://kiwibee.io/fa/simulations/function-grapher-simulation/embed" title="Function Grapher | KiwiBee" loading="lazy" allowfullscreen style="width:100%;height:min(70vh,620px);min-height:420px;border:0;border-radius:16px"></iframe>کاوش را ادامه دهید
Spin a spinner, flip a coin or roll a die and watch two sets of bars: the chances the shapes predict, and the results you actually got. Ten spins prove nothing; a few hundred and the two are hard to tell apart.

Move m and watch the line tilt; move b and watch it slide. Or drag the two points on the line and read the equation it writes back. A rise-over-run staircase climbs the line so slope becomes something you can count.
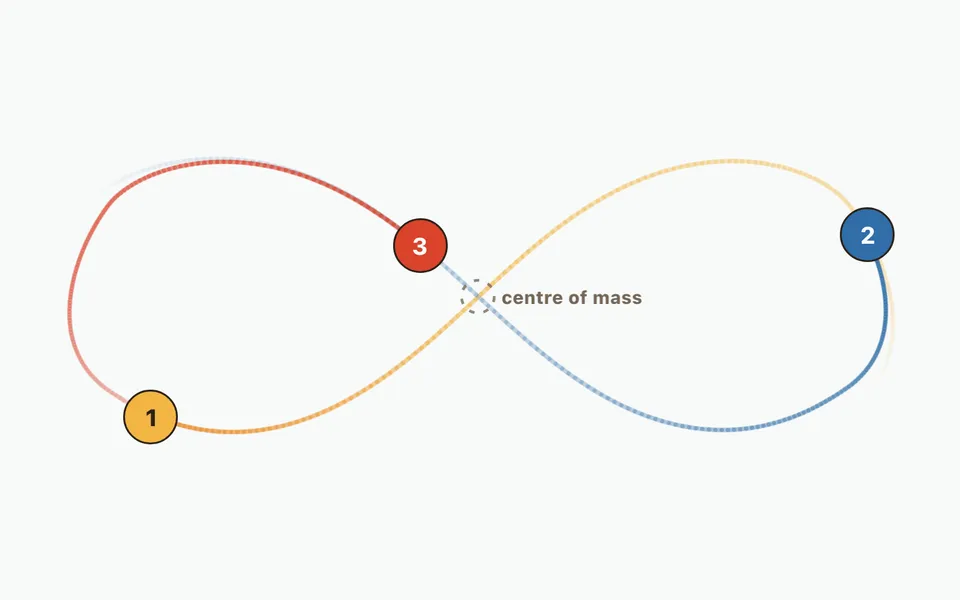
Compare a two-body orbit with three-body figure-eight motion, then add up to twelve bodies. Change initial masses, velocities and positions; watch orbit trails and numerical energy error.

Approximate the area under a curve with strips and choose how each takes its height: left edge, right edge, middle, or a sloping top. Push the strip count up and watch the error fall, with the running total plotted as its own curve.

Pick two fractions and see them as bars, pies or jumps on a number line. Compare them, find equivalent fractions such as 1/2 = 2/4 = 3/6, and add fractions with unlike denominators: the picture shows why both must be cut into pieces of the same size before they can be counted together.
از مدل تا شواهد
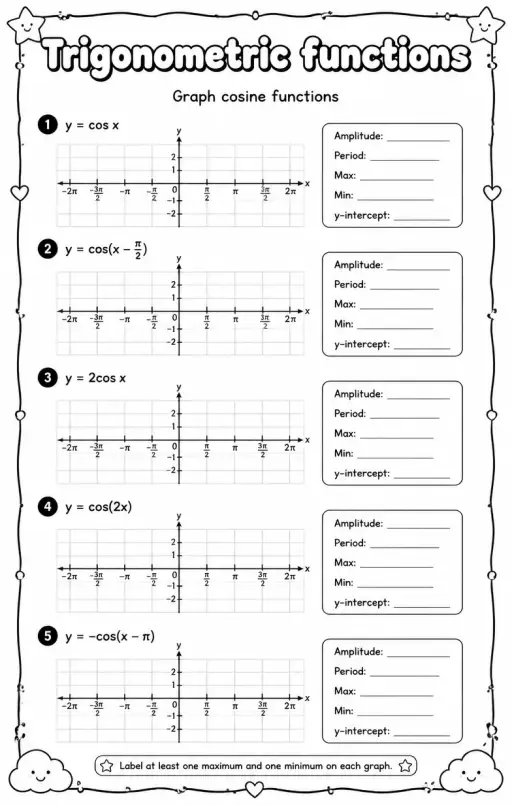
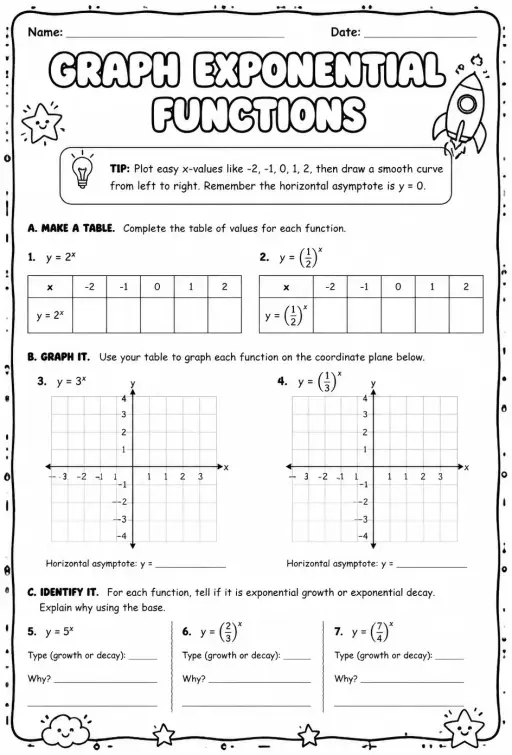
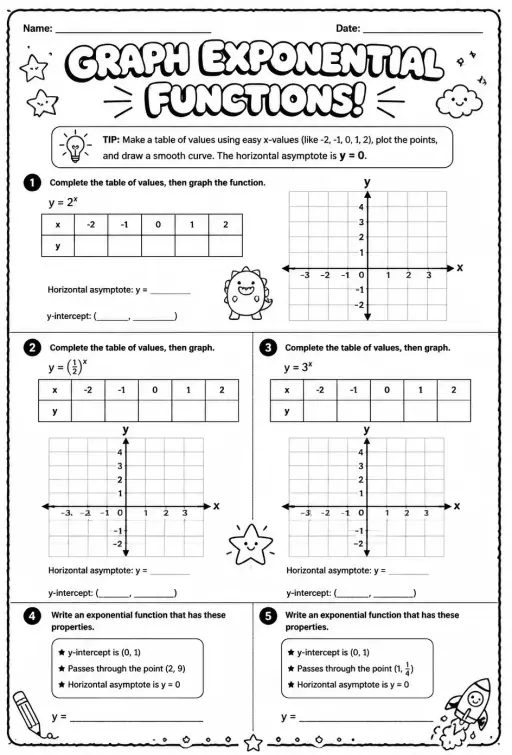
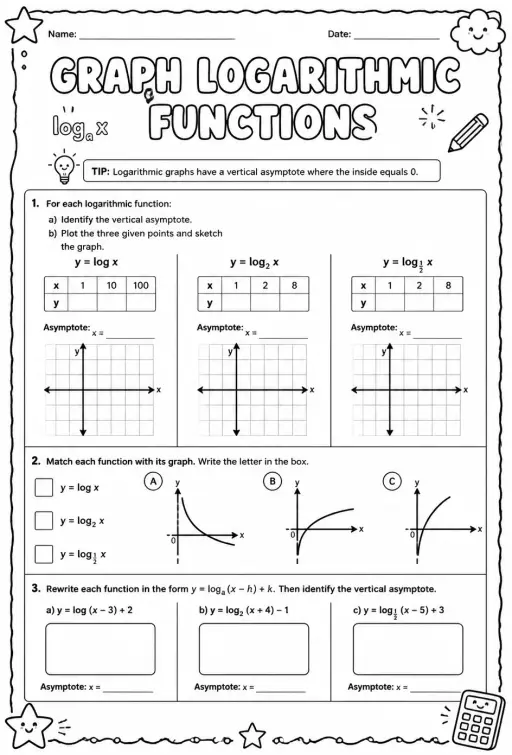
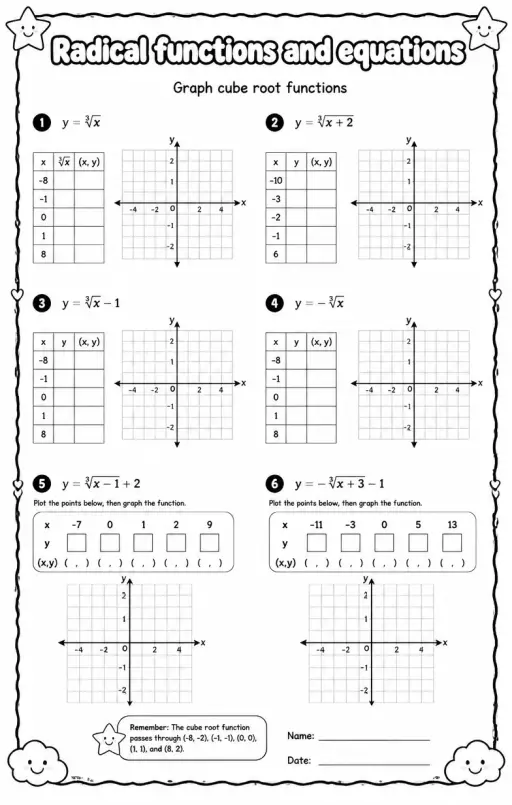
پس از کاوش دانشآموزان، از یک کاربرگ برای ثبت پیشبینیها، مشاهدات و توضیحها استفاده کنید.
فضای کاری رایگان معلمان KiwiBee برنامهریزی درس، کاربرگها، ابزارهای کلاسی و دفتر نمره را یکجا گرد هم میآورد.
رایگان شروع کنید و اولین کلاس خود را بسازید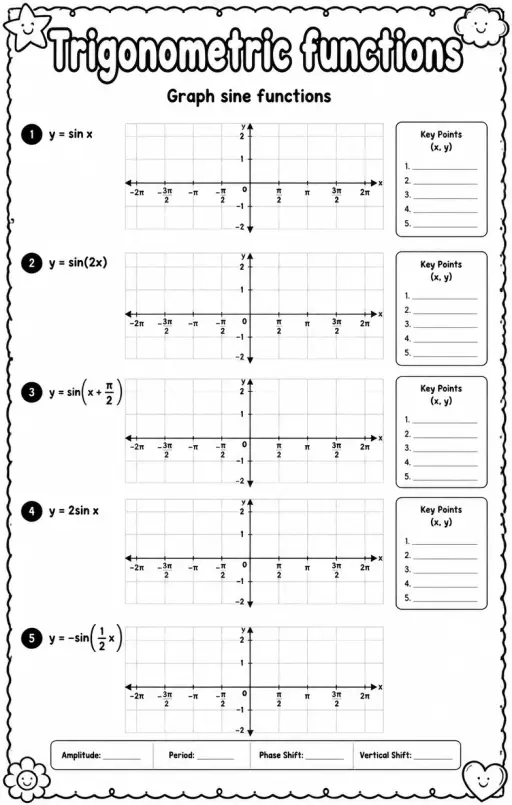
 خانه
 همهٔ راهکارها
 قیمتگذاری
 درباره ما
 KiwiBee برای سازمانهای غیرانتفاعی
 رویدادها و وبینارها
 برای سازمانهای بزرگ
 برای مدرسهها
 برای مراکز
 برای سرپرستان تیم
 برای معلمان
 هوش مصنوعی و منابع
 منابع
 کاربرگهای قابل چاپ
 بستههای درس
 شبیهسازیهای تعاملی
 ابزارهای معلم
 استودیوی هوش مصنوعی
 ایدهها و پژوهش