
Type any function and see its shape straight away. Plot up to three at once in three colours to compare them, drag the trace point to read a value off a curve, and see where each one crosses zero.
—
KiwiBee uses optional Google Analytics, Google Ads, and Meta Pixel cookies to understand adult visitors, measure completed sign-ups, and improve campaigns. Essential cookies always stay on. OpenAI’s ChatGPT Ads Pixel also measures page views and completed enquiries after advertising consent, and may use hashed contact details for matching. Privacy policy
Draw repeated samples from uniform, skewed or two-peaked populations. Compare the population histogram with the histogram of sample means.
បាទ/ចាស។ បើកការពិសោធន៍និម្មិត Central Limit Theorem Lab ក្នុងកម្មវិធីរុករកទំនើប ដោយមិនចាំបាច់ទាញយក ឬចុះឈ្មោះ។
ការពិសោធន៍និម្មិតនេះមានការកំណត់ជាមុនសម្រាប់កម្រិតសិក្សា គ្របដណ្តប់ កម្រិតមធ្យមសិក្សា និងវិទ្យាល័យ។ ជ្រើសកម្រិតដែលសមនឹងថ្នាក់របស់អ្នក បន្ទាប់មកប្រើវាលើម៉ាស៊ីនបញ្ចាំង ឬឧបករណ៍របស់សិស្ស។
ដាក់វាចូលទៅក្នុង LMS ប្លក់ ឬគេហទំព័រថ្នាក់រៀនរបស់អ្នក — ឥតគិតថ្លៃ។
<iframe src="https://kiwibee.io/km/simulations/central-limit-theorem-simulation/embed" title="Central Limit Theorem Lab | KiwiBee" loading="lazy" allowfullscreen style="width:100%;height:min(70vh,620px);min-height:420px;border:0;border-radius:16px"></iframe>បន្តស្វែងរក
Type any function and see its shape straight away. Plot up to three at once in three colours to compare them, drag the trace point to read a value off a curve, and see where each one crosses zero.

Spin a spinner, flip a coin or roll a die and watch two sets of bars: the chances the shapes predict, and the results you actually got. Ten spins prove nothing; a few hundred and the two are hard to tell apart.

Move m and watch the line tilt; move b and watch it slide. Or drag the two points on the line and read the equation it writes back. A rise-over-run staircase climbs the line so slope becomes something you can count.
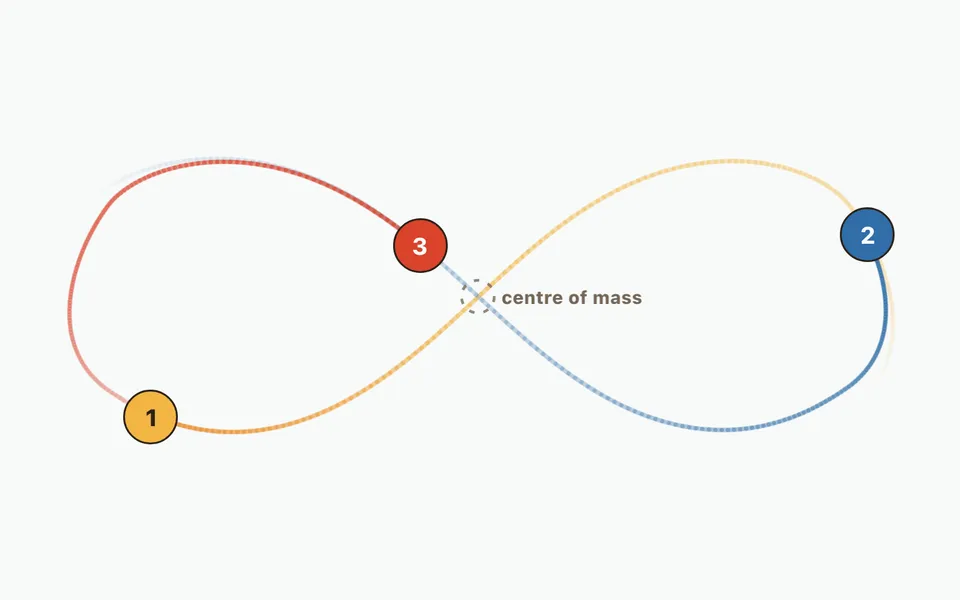
Two bodies under gravity trace an ellipse forever and you can write the formula down. Add a third and no such formula exists. Run the figure-eight orbit, nudge one mass, and watch a stable pattern become unpredictable while the total energy stays put.

Approximate the area under a curve with strips and choose how each takes its height: left edge, right edge, middle, or a sloping top. Push the strip count up and watch the error fall, with the running total plotted as its own curve.
ពីម៉ូដែលទៅភស្តុតាង
ប្រើសន្លឹកកិច្ចការដើម្បីកត់ត្រាការព្យាករណ៍ ការសង្កេត និងការពន្យល់ បន្ទាប់ពីសិស្សបានស្វែងយល់។
ទីតាំងការងារសម្រាប់គ្រូដោយឥតគិតថ្លៃ KiwiBee នាំមកនូវការរៀបចំមេរៀន សន្លឹកកិច្ចការ ឧបករណ៍ក្នុងថ្នាក់ និងសៀវភៅពិន្ទុ ទាំងអស់នៅកន្លែងតែមួយ។
ចាប់ផ្តើមឥតគិតថ្លៃ និងបង្កើតថ្នាក់ដំបូងរបស់អ្នក
 ទំព័រដើម
 ដំណោះស្រាយទាំងអស់
 តម្លៃ
 អំពីយើង
 KiwiBee សម្រាប់អង្គការមិនស្វែងរកប្រាក់ចំណេញ
 ព្រឹត្តិការណ៍ និងសិក្ខាសាលាអនឡាញ
 សម្រាប់អង្គភាពធំ
 សម្រាប់សាលារៀន
 សម្រាប់មជ្ឈមណ្ឌល
 សម្រាប់ប្រធានក្រុម
 សម្រាប់គ្រូ
 AI និងធនធាន
 ធនធាន
 សន្លឹកកិច្ចការសម្រាប់បោះពុម្ព
 កញ្ចប់មេរៀន
 ការពិសោធន៍និម្មិតអន្តរកម្ម
 ឧបករណ៍គ្រូ
 ស្ទូឌីយ៉ូ AI
 គំនិត និងការស្រាវជ្រាវ