
Type any function and see its shape straight away. Plot up to three at once in three colours to compare them, drag the trace point to read a value off a curve, and see where each one crosses zero.
—
KiwiBee uses optional Google Analytics, Google Ads, and Meta Pixel cookies to understand adult visitors, measure completed sign-ups, and improve campaigns. Essential cookies always stay on. OpenAI’s ChatGPT Ads Pixel also measures page views and completed enquiries after advertising consent, and may use hashed contact details for matching. Privacy policy
In y = mx + b the two numbers have two separate jobs: m decides how steeply the line tilts, and b decides where it crosses the y-axis. Changing one at a time makes that split visible, and the rise-over-run staircase turns the definition of slope into something you can count off the grid — one step across, m steps up, from wherever you start. Students can change slope and y-intercept and compare what happens. Use it for math inquiry with Middle School and High School on a projector or student device.
ស្តង់ដារ៖ Common Core CCSS.MATH.CONTENT.8.EE.B.6, CCSS.MATH.CONTENT.8.F.A.3
Yes. Open the Slope and Intercept Grapher simulation in a modern browser with no download or sign-up required.
The simulation includes learning-level presets spanning Middle School and High School. Choose the level that matches your class, then use it on a projector or student devices.
ដាក់វាចូលទៅក្នុង LMS ប្លក់ ឬគេហទំព័រថ្នាក់រៀនរបស់អ្នក — ឥតគិតថ្លៃ។
<iframe src="https://kiwibee.io/km/simulations/slope-and-intercept-simulation/embed" title="Slope and Intercept Grapher | KiwiBee" loading="lazy" allowfullscreen style="width:100%;height:min(70vh,620px);min-height:420px;border:0;border-radius:16px"></iframe>បន្តស្វែងរក
Type any function and see its shape straight away. Plot up to three at once in three colours to compare them, drag the trace point to read a value off a curve, and see where each one crosses zero.

Spin a spinner, flip a coin or roll a die and watch two sets of bars: the chances the shapes predict, and the results you actually got. Ten spins prove nothing; a few hundred and the two are hard to tell apart.
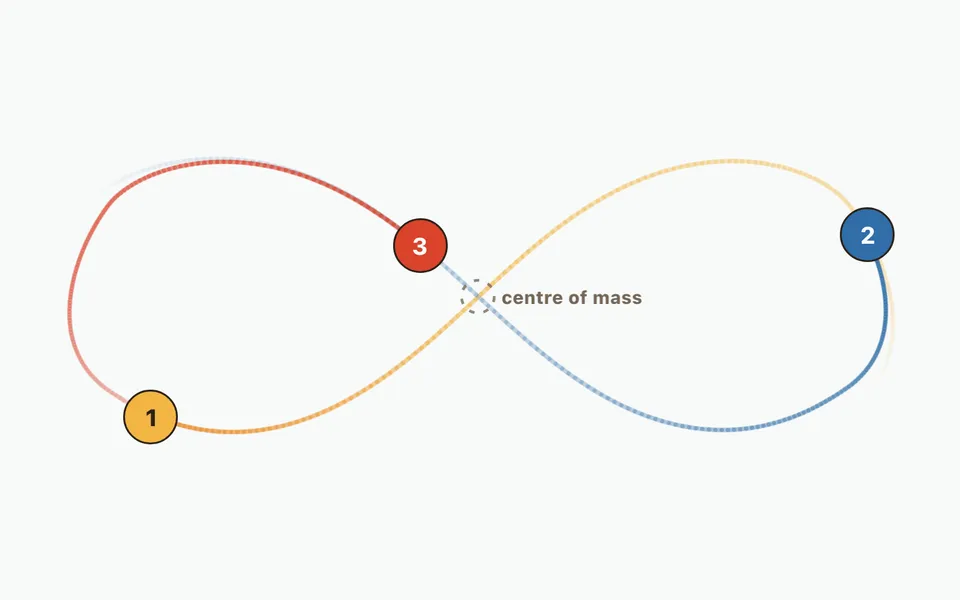
Compare a two-body orbit with three-body figure-eight motion, then add up to twelve bodies. Change initial masses, velocities and positions; watch orbit trails and numerical energy error.

Approximate the area under a curve with strips and choose how each takes its height: left edge, right edge, middle, or a sloping top. Push the strip count up and watch the error fall, with the running total plotted as its own curve.

Pick two fractions and see them as bars, pies or jumps on a number line. Compare them, find equivalent fractions such as 1/2 = 2/4 = 3/6, and add fractions with unlike denominators: the picture shows why both must be cut into pieces of the same size before they can be counted together.
ពីម៉ូដែលទៅភស្តុតាង
ប្រើសន្លឹកកិច្ចការដើម្បីកត់ត្រាការព្យាករណ៍ ការសង្កេត និងការពន្យល់ បន្ទាប់ពីសិស្សបានស្វែងយល់។
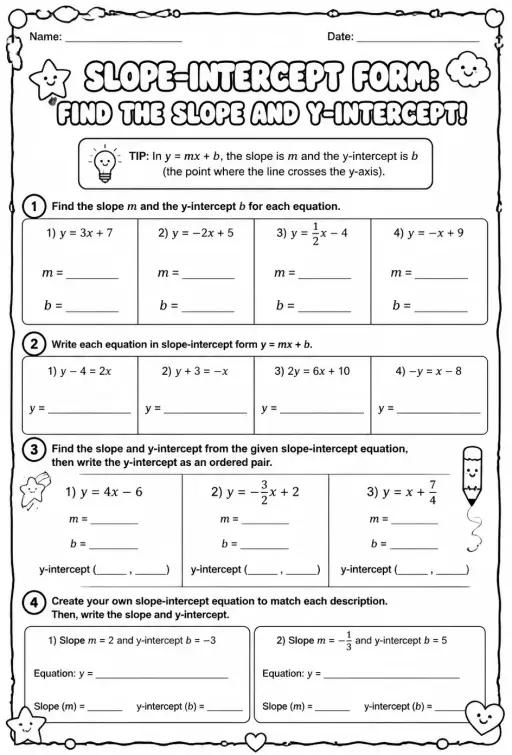
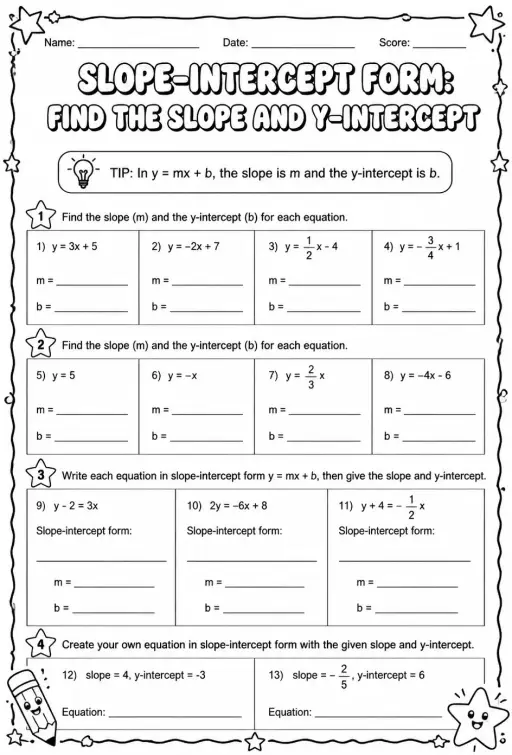
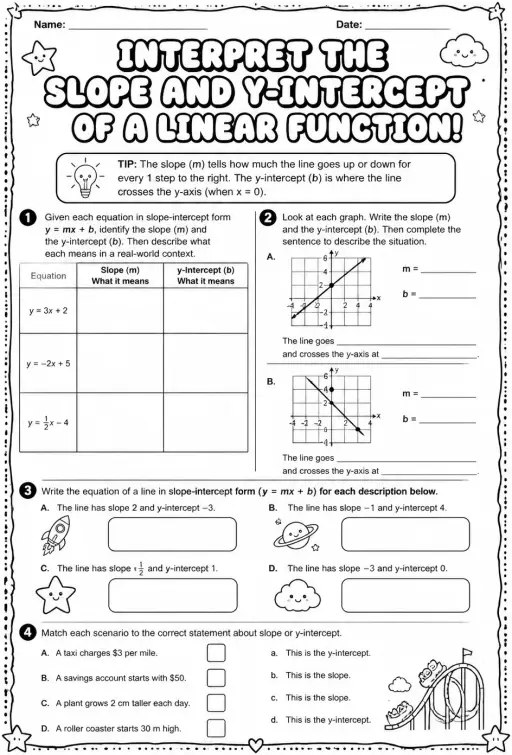
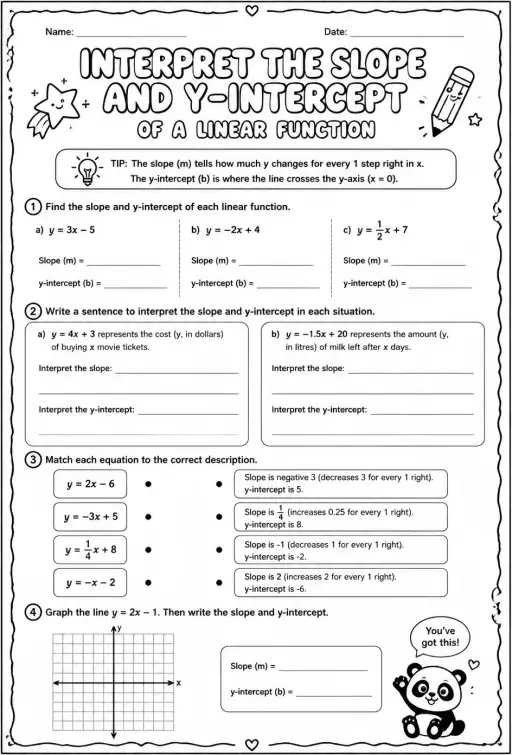
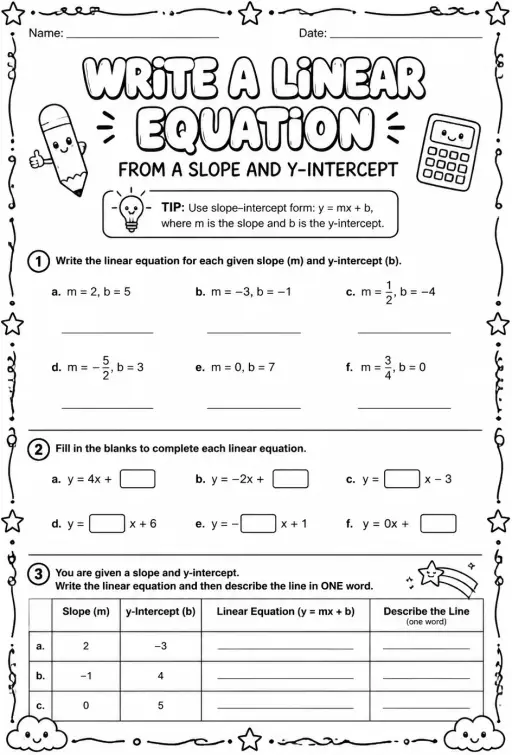
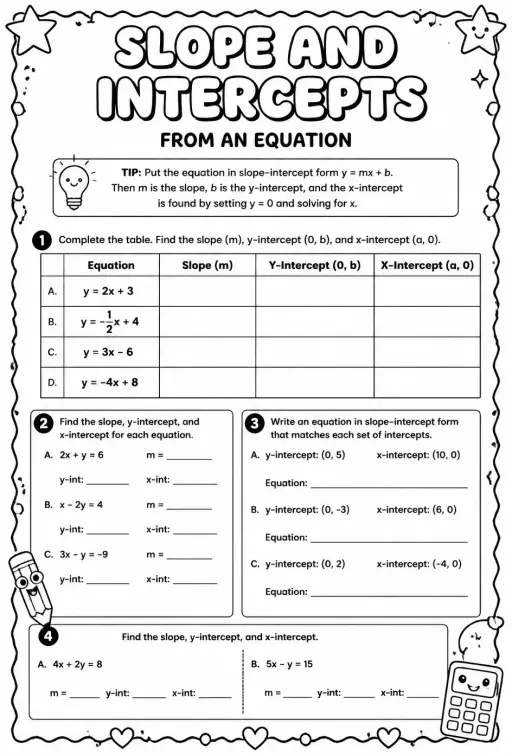
ទីតាំងការងារសម្រាប់គ្រូដោយឥតគិតថ្លៃ KiwiBee នាំមកនូវការរៀបចំមេរៀន សន្លឹកកិច្ចការ ឧបករណ៍ក្នុងថ្នាក់ និងសៀវភៅពិន្ទុ ទាំងអស់នៅកន្លែងតែមួយ។
ចាប់ផ្តើមឥតគិតថ្លៃ និងបង្កើតថ្នាក់ដំបូងរបស់អ្នក ទំព័រដើម
 ដំណោះស្រាយទាំងអស់
 តម្លៃ
 អំពីយើង
 KiwiBee សម្រាប់អង្គការមិនស្វែងរកប្រាក់ចំណេញ
 ព្រឹត្តិការណ៍ និងសិក្ខាសាលាអនឡាញ
 សម្រាប់អង្គភាពធំ
 សម្រាប់សាលារៀន
 សម្រាប់មជ្ឈមណ្ឌល
 សម្រាប់ប្រធានក្រុម
 សម្រាប់គ្រូ
 AI និងធនធាន
 ធនធាន
 សន្លឹកកិច្ចការសម្រាប់បោះពុម្ព
 កញ្ចប់មេរៀន
 ការពិសោធន៍និម្មិតអន្តរកម្ម
 ឧបករណ៍គ្រូ
 ស្ទូឌីយ៉ូ AI
 គំនិត និងការស្រាវជ្រាវ