
3D Point Plotter
- Mathématiques
Commentaires
Liées à cette simulation
Choisis selon le sens parmi les jeux, fiches, simulations, outils pour les enseignants et vidéos.

À propos de cette simulation
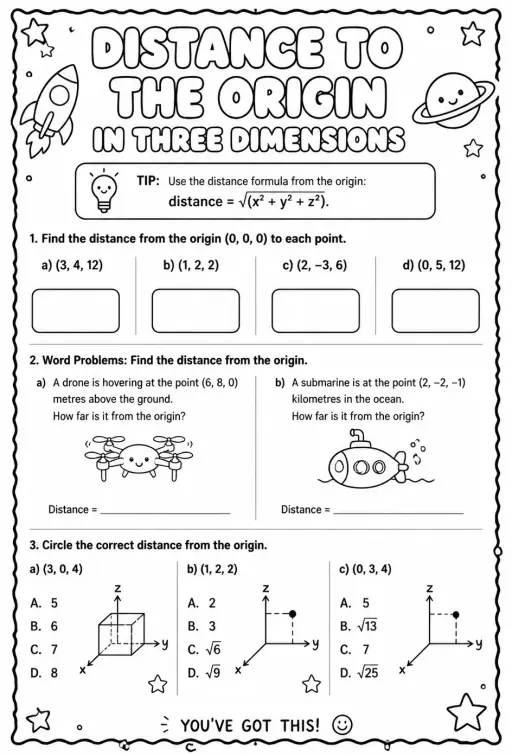
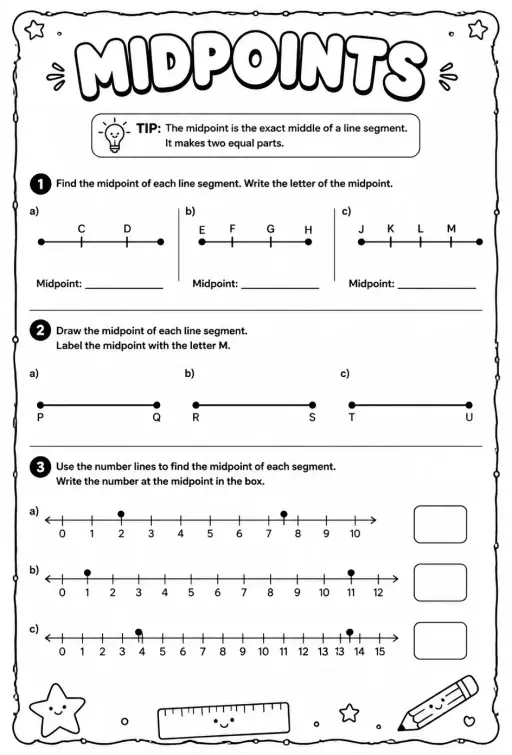
3D Point Plotter lets students move a red point P and a teal point Q inside a coordinate box with x, y and z axes. A Drag plane menu chooses the floor, wall or side plane, and the third coordinate stays fixed while dragging. Coordinates snap to half units between -5 and 5. Readouts show P, Q, the distance OP, the distance PQ and the midpoint M, and projection lines drop to the planes. It is a good first look at three-dimensional coordinates and at extending the distance and midpoint formulas to space.
Ce que les élèves peuvent explorer
- Drag the red ball on the floor plane and note how x and z change while y stays the same.
- Change Drag plane to XY (wall) and drag again to see which coordinate is now fixed.
- Turn on the second point Q and read Distance PQ as you move it away from P.
- Place P and Q so the midpoint M has whole-number coordinates and check the readout.
- Toggle Projection lines to see how each coordinate is measured from the planes.
Objectifs d'apprentissage
- 1Read and plot a point using three coordinates (x, y, z).
- 2Describe how moving in one plane keeps the third coordinate fixed.
- 3Calculate distance between two points in space and check it with the readout.
- 4Find the midpoint of a segment by averaging each coordinate.
Questions fréquentes des enseignants
Is it free?
Yes, it costs nothing and needs no account. Open it in any current browser on a whiteboard, tablet, Chromebook or phone and it just works.
How is distance in 3D calculated?
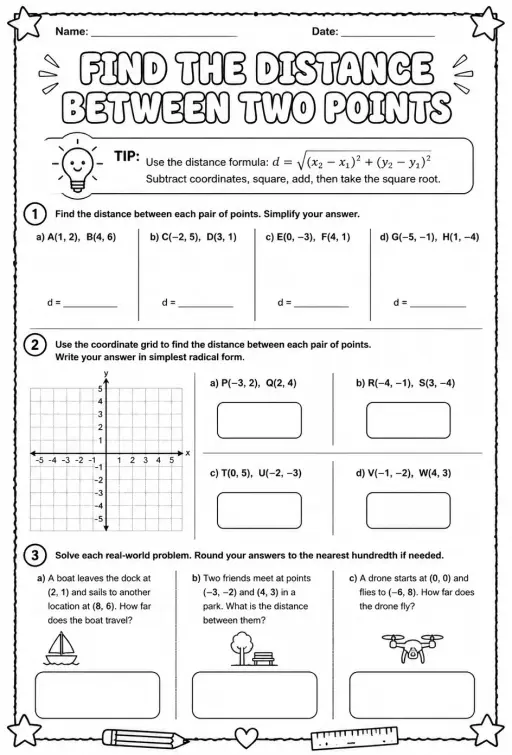
Take the square root of the sum of the squared differences in x, y and z. It is Pythagoras applied twice, first on the floor and then upward with the height.
Which axis is which color?
The x axis is red, the y axis is green and the z axis is blue. In this simulation the floor is the XZ plane and y is the height.
How do I move a point in the third direction?
Switch the Drag plane menu to a different plane. Each plane lets the point slide in two directions, so using two planes lets you reach any position.
Intégrer cette simulation
Placez-la dans votre ENT, votre blog ou le site de la classe — gratuitement.
<iframe src="https://kiwibee.io/fr/simulations/3d-point-plotter-3d-simulation/embed" title="3D Point Plotter | KiwiBee" loading="lazy" allowfullscreen style="width:100%;height:min(70vh,620px);min-height:420px;border:0;border-radius:16px"></iframe>Objectifs du programme
Cambridge
- 9Gp.02Use knowledge of coordinates to find points on a line segment.Cambridge Lower Secondary Mathematics (0862) — Stage 9 › Geometry and Measure › Position and transformation
Learning objectives © UCLES (Cambridge University Press & Assessment), quoted with attribution.
Faites entrer les sciences interactives dans votre classe
L'espace enseignant gratuit de KiwiBee réunit au même endroit la préparation des séances, les fiches, les outils de classe et le carnet de notes.
Commencez gratuitement et créez votre première classeRegardez KiwiBee sur YouTube
De courtes vidéos KiwiBee pour les enseignants et les écoles. Abonnez-vous, ou suivez KiwiBee où que vous soyez.
 Accueil
 Toutes les solutions
 Tarifs
 À propos
 KiwiBee pour les associations
 Événements et webinaires
 Pour les grands réseaux
 Pour les établissements
 Pour les centres
 Pour les responsables d'équipe
 Pour les enseignants
 Ressources
 Fiches imprimables
 Simulations interactives
 Outils pour les enseignants
 Idées et recherche


