KiwiBee printable
Create and interpret line plots with fractions
Free printable Grade 5 math worksheet for "Create and interpret line plots with fractions" — practice data and graphs. No-prep, print or assign online.
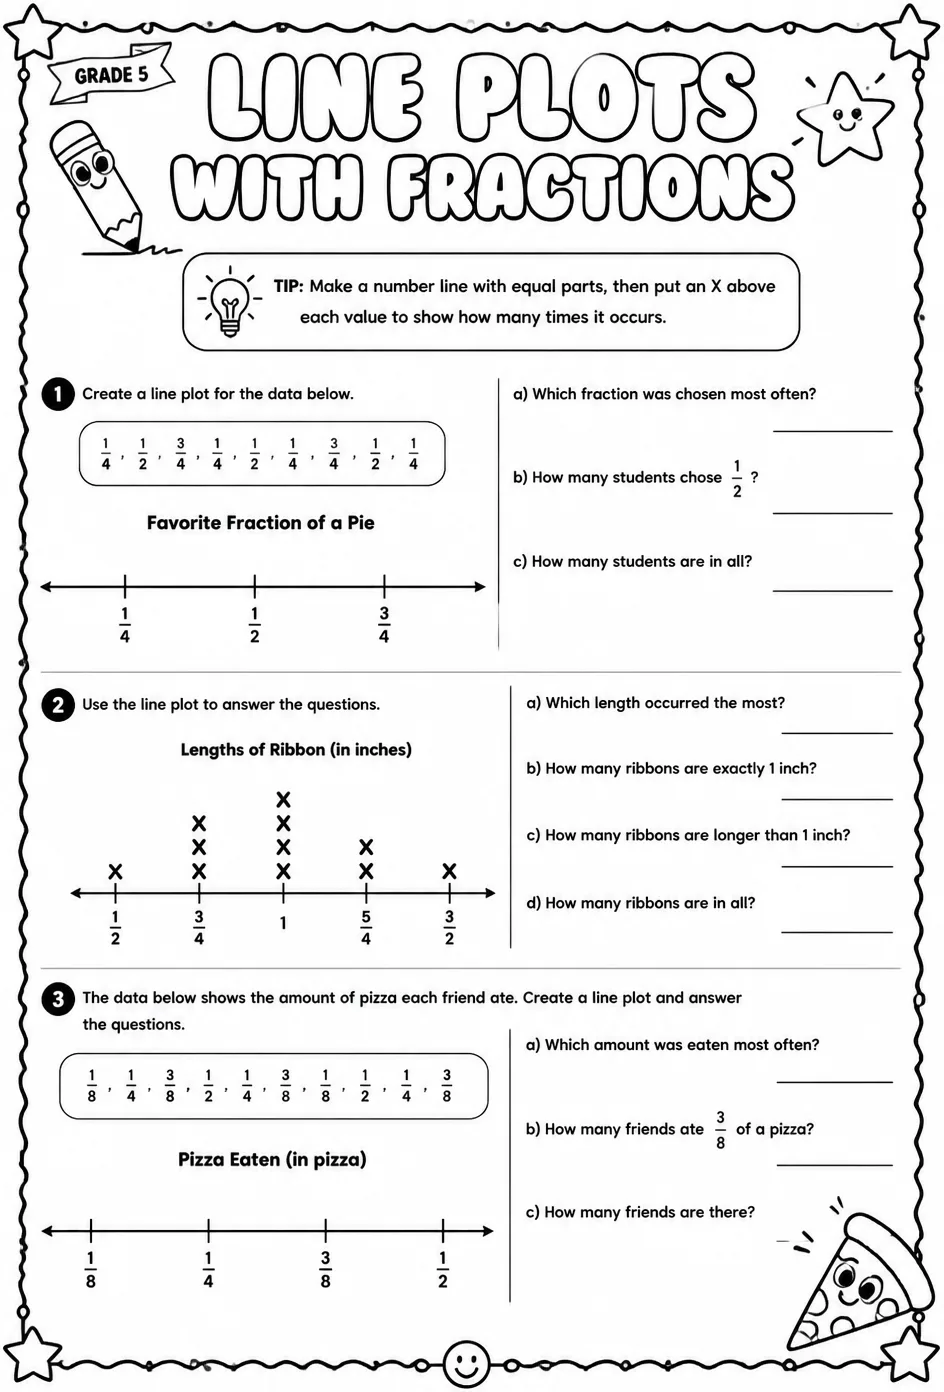
This worksheet guides students through creating and interpreting line plots with fractional values, reinforcing their understanding of fractions in data representation. Teachers can use this resource to support lessons on data analysis and graphing skills, focusing on fractions and measurement. It is ideal for enhancing students' abilities to read, construct, and draw conclusions from line plots involving fractional data.
Learning objectives
- Plot fractional data points accurately on a line plot.
- Analyze line plots to interpret fractional data distributions.
- Compare and explain differences between fractions represented on a line plot.
How to use this worksheet
- Click “Download Worksheet” and sign in with Google or email to get the PDF instantly.
- Print at home or in class for Grade 5; it's no-prep, with no extra materials needed.
- Hand it out as classwork, homework, or a quick warm-up.
Frequently asked questions
Is the “Create and interpret line plots with fractions” worksheet free?
Yes. “Create and interpret line plots with fractions” is a free printable Math worksheet. Sign in with Google or email to download the PDF instantly.
What grade or age is this Math worksheet for?
It's designed for Grade 5 (ages 10–11), covering Data and graphs.
Do I need to prep anything?
No. It's a no-prep, print-and-go worksheet — just download and hand it out.
Likes & comments
See what other teachers think and share a helpful note.
Create more worksheets in our Worksheet Studio
Generate fresh worksheets for any grade, topic, and language — free.
Open the Worksheet StudioYou might also like
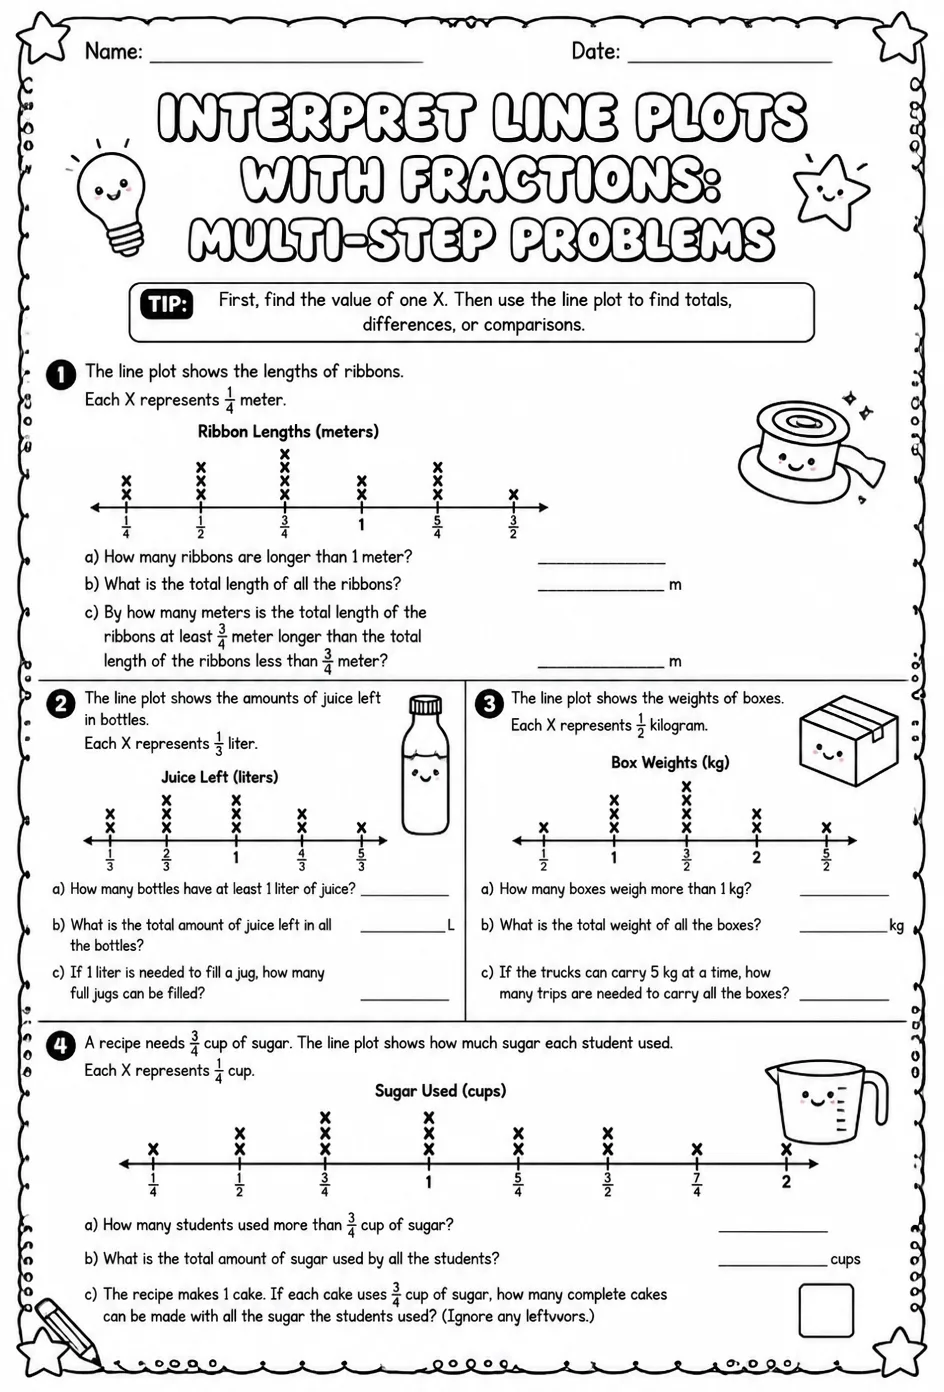
Create and interpret line plots with fractions
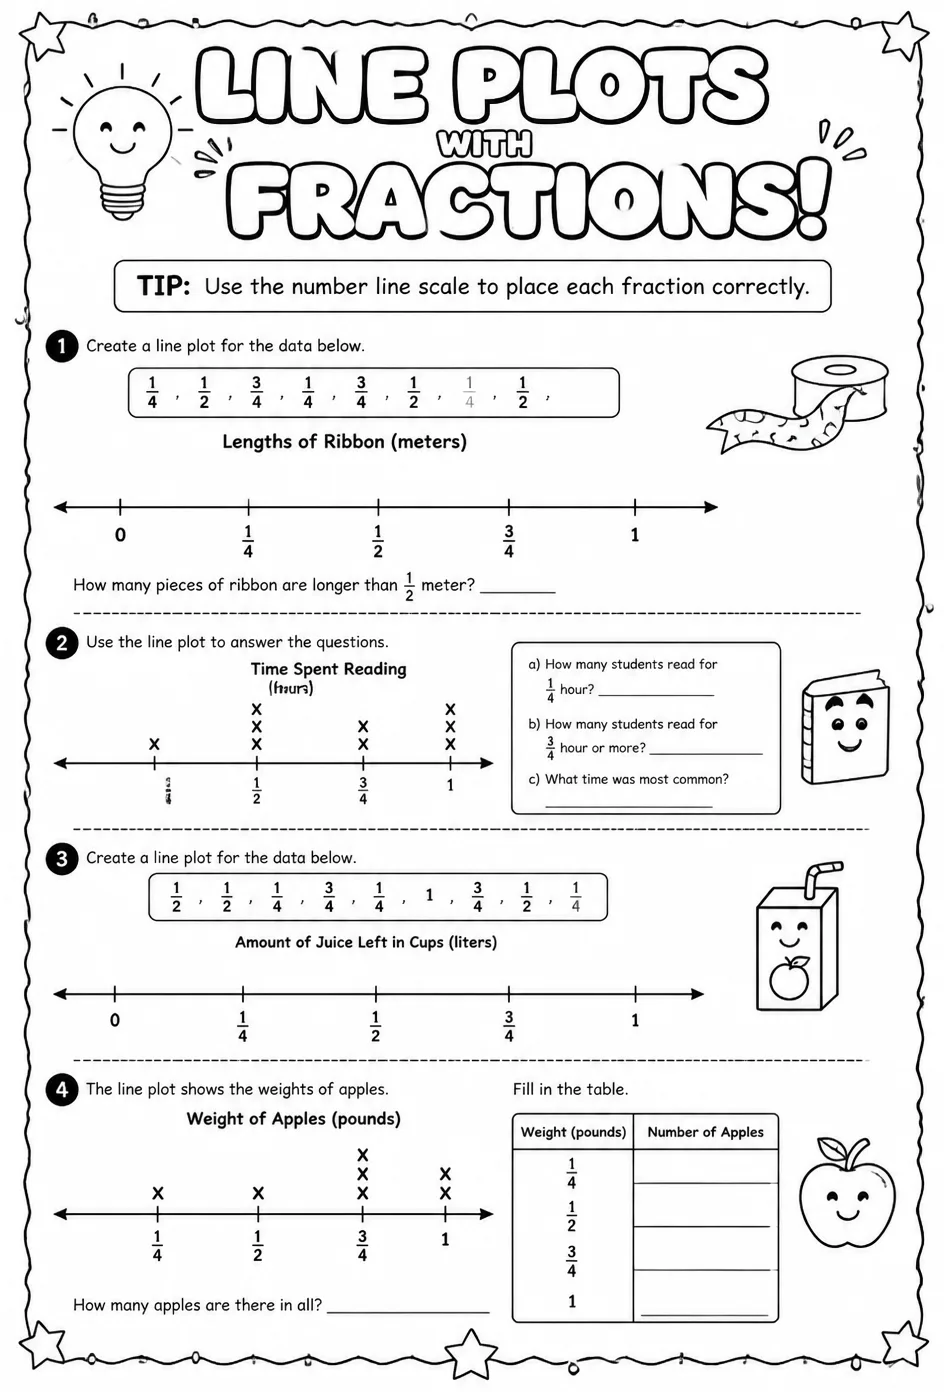
Create and interpret line plots with fractions
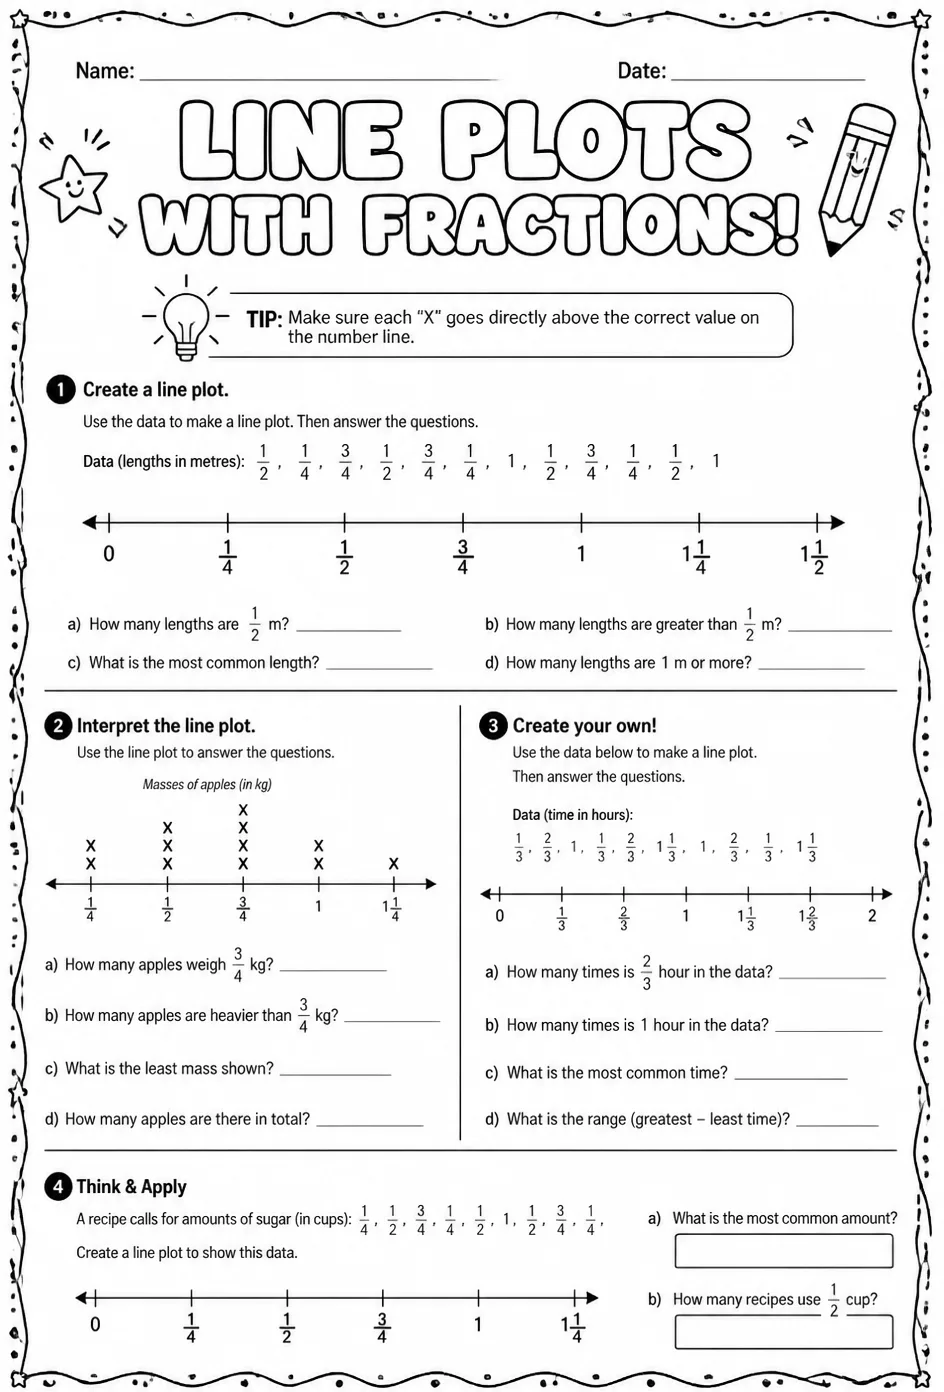
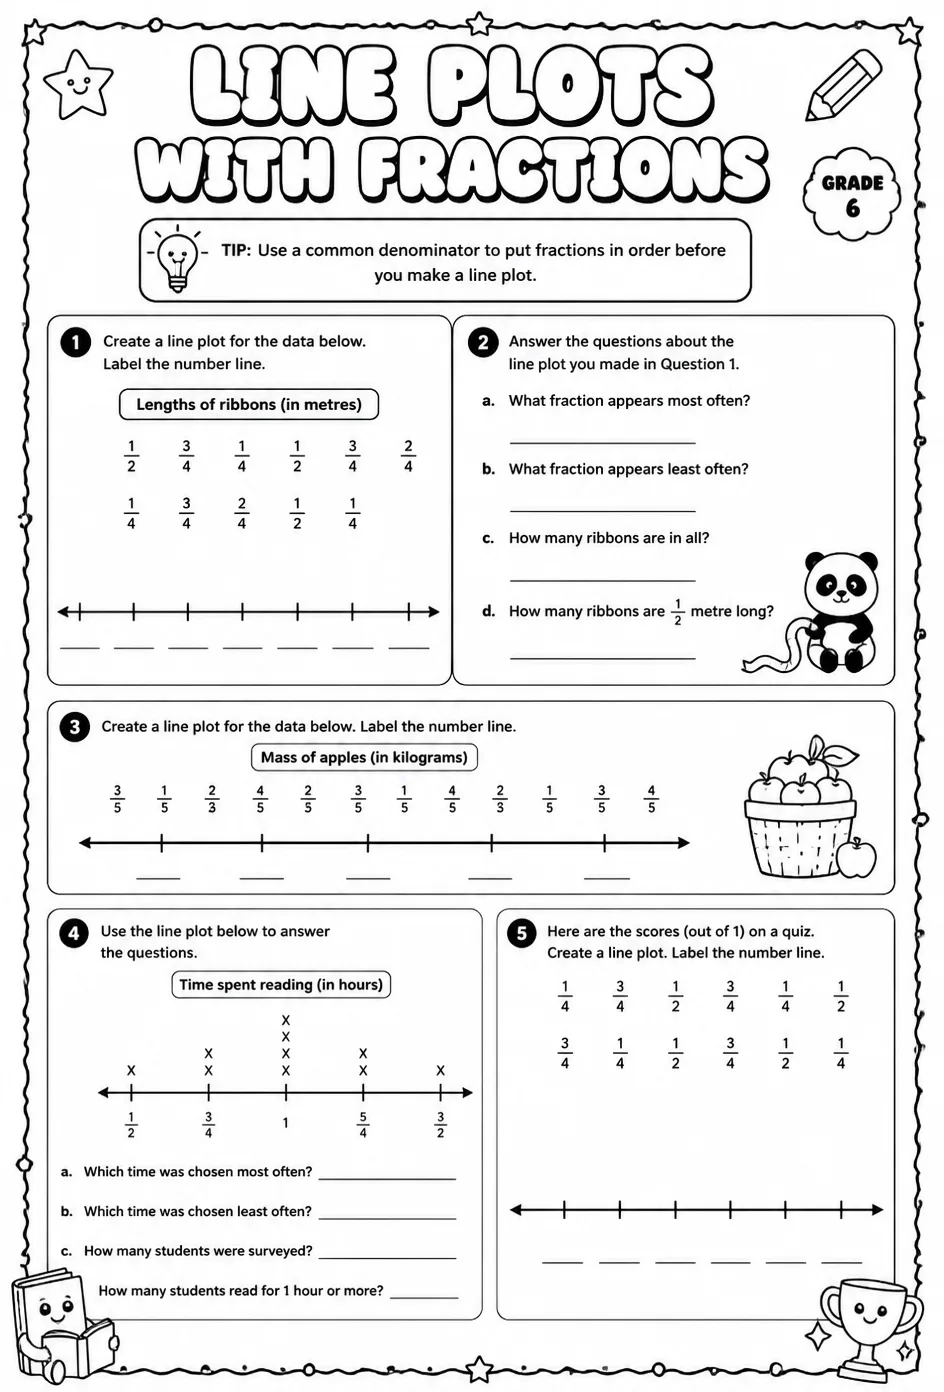
Create and interpret line plots with fractions
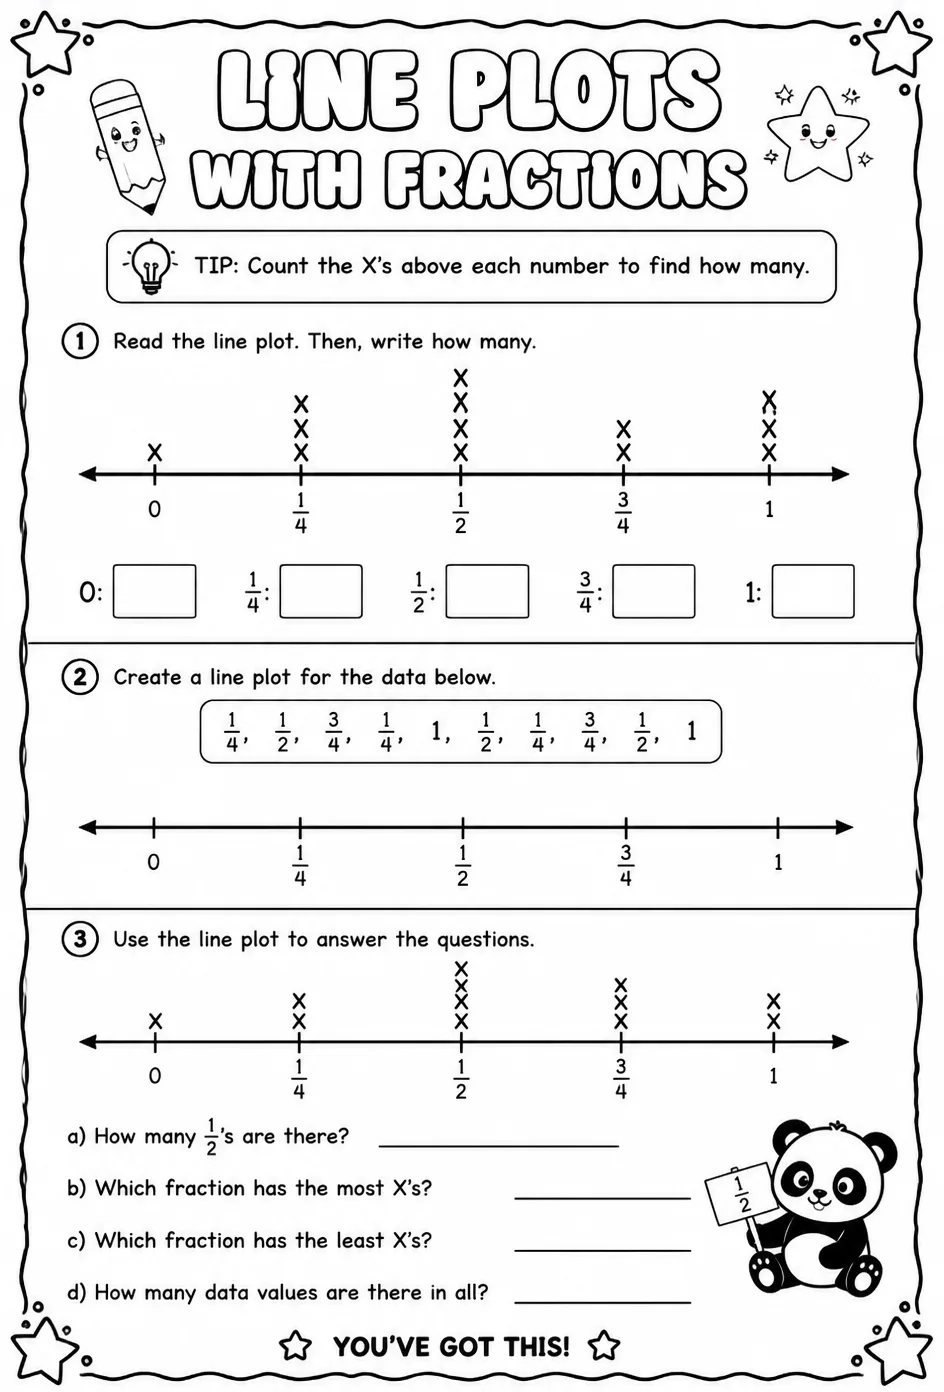
Create and interpret line plots with fractions
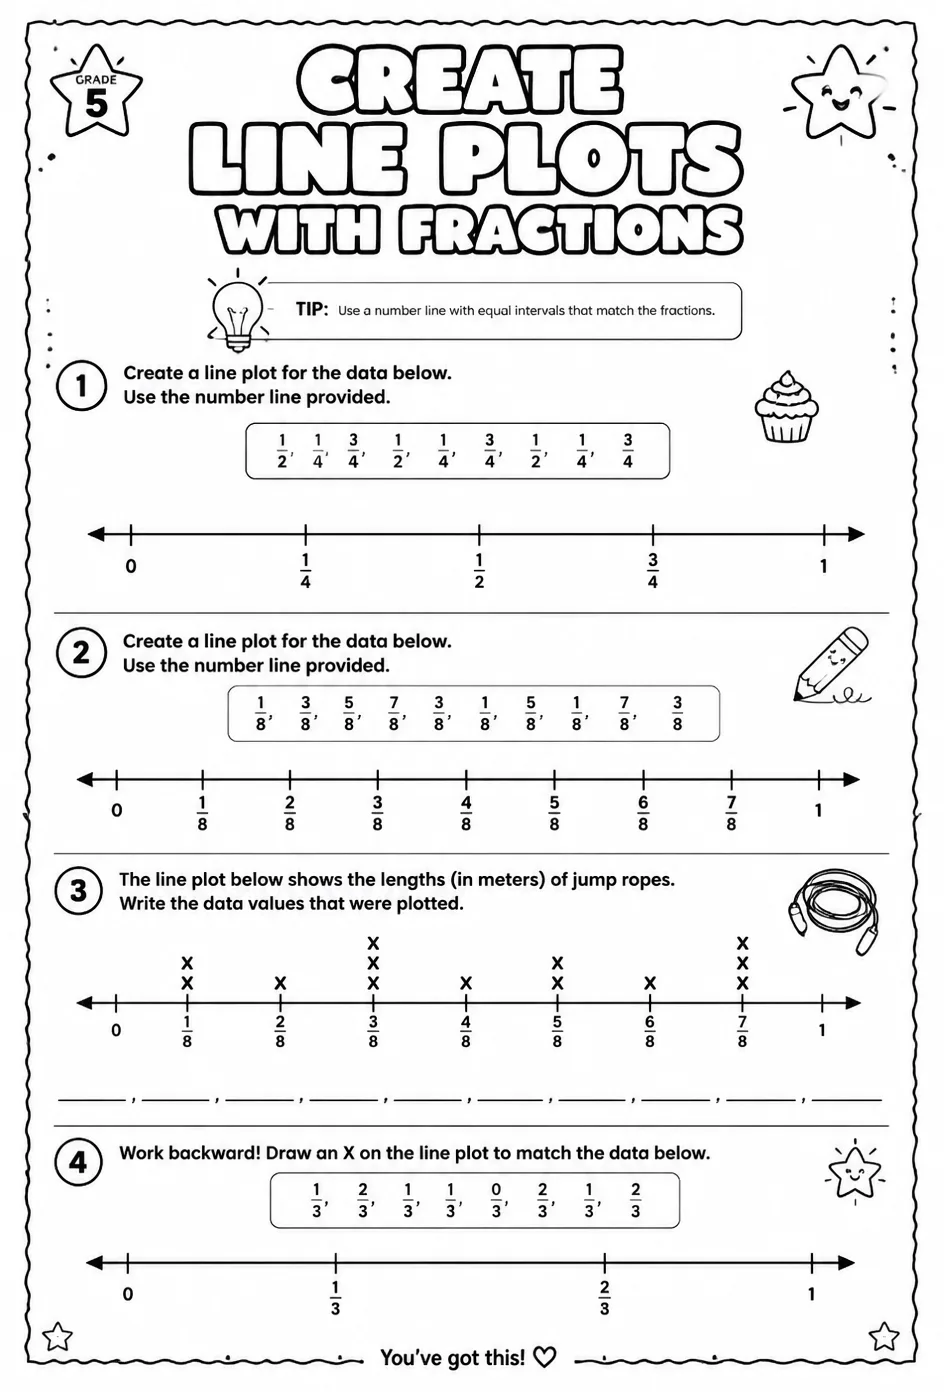
Create line plots with fractions