Interpret scaled bar graphs
Free printable Grade 3 math worksheet for "Interpret scaled bar graphs" — practice data and graphs. No-prep, print or assign online.
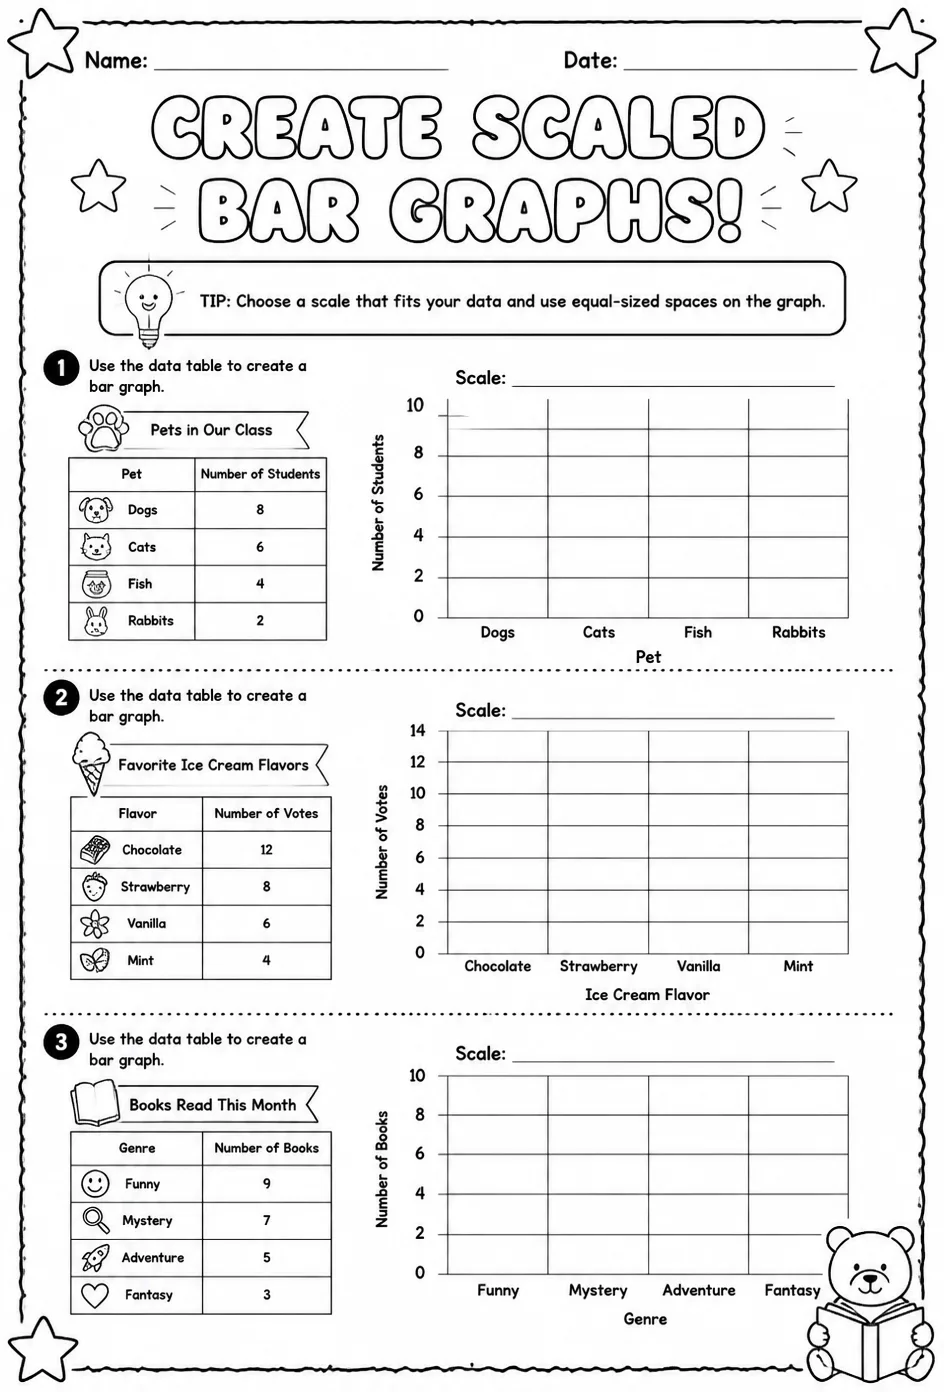
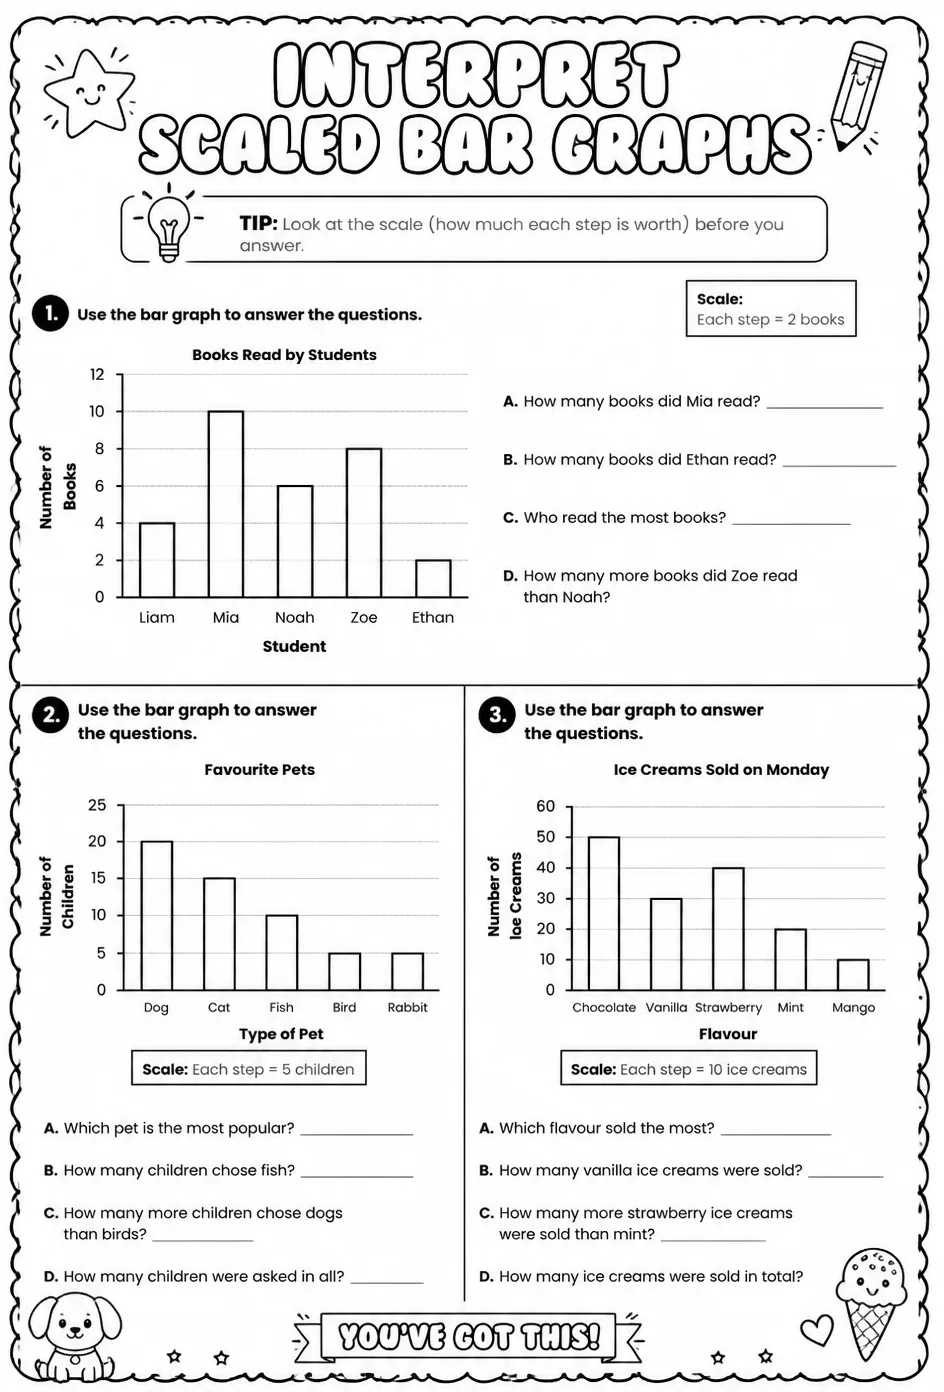
This worksheet helps Grade 3 students practice interpreting scaled bar graphs by reading and comparing data points. Teachers can use it to reinforce skills in understanding data representation and scaling in graphs. It supports developing critical thinking in data analysis and enhances students' ability to extract meaningful information from visual data displays.
Learning objectives
- Analyze scaled bar graphs to identify data values accurately
- Compare quantities represented on scaled bar graphs
- Draw conclusions based on information presented in scaled bar graphs
How to use this worksheet
- Click “Download Worksheet” and sign in with Google or email to get the PDF instantly.
- Print at home or in class for Grade 3; it's no-prep, with no extra materials needed.
- Hand it out as classwork, homework, or a quick warm-up.
Frequently asked questions
Is the “Interpret scaled bar graphs” worksheet free?
Yes. “Interpret scaled bar graphs” is a free printable Math worksheet. Sign in with Google or email to download the PDF instantly.
What grade or age is this Math worksheet for?
It's designed for Grade 3 (ages 8–9), covering Data and graphs.
Do I need to prep anything?
No. It's a no-prep, print-and-go worksheet — just download and hand it out.
Create more worksheets in our Worksheet Studio
Generate fresh worksheets for any grade, topic, and language — free.
Open the Worksheet StudioMore for Grade 3

You might also like
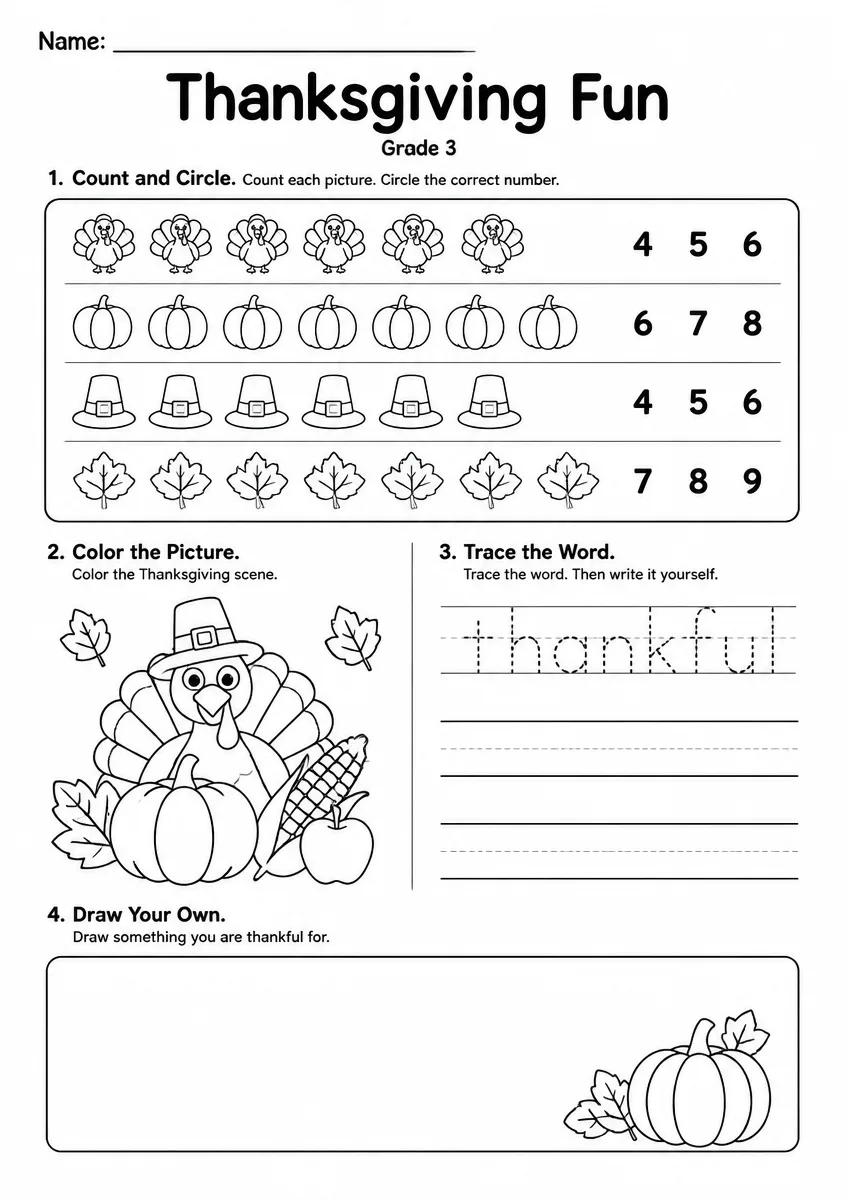
Thanksgiving Worksheet — Grade 3
Fractions Bingo — Grade 3 | Free Classroom Game
Multiplication Facts Bingo — Grade 3 | Free Classroom Game
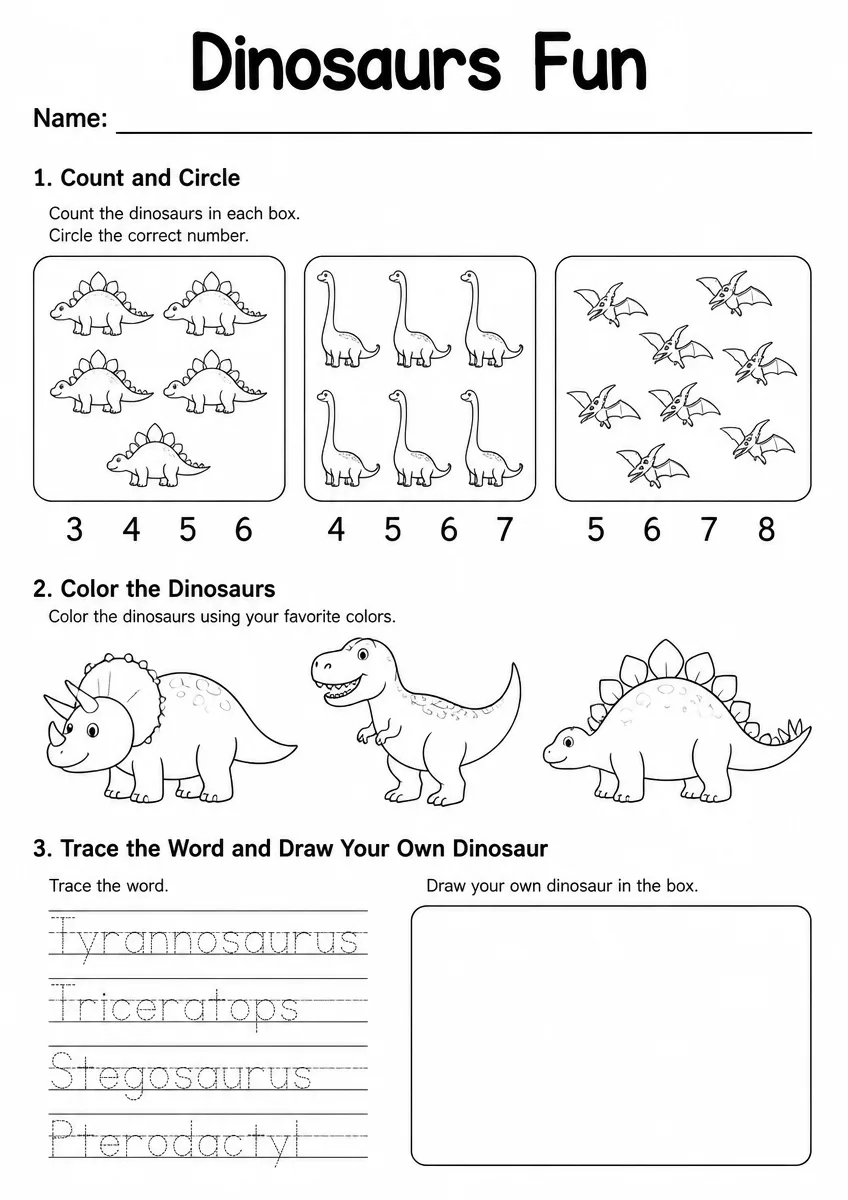
Dinosaurs Worksheet — Grade 3