
3D Point Plotter
- Matemáticas
Comentarios
Relacionado con esta simulación
Elegidos por su significado entre juegos, fichas, simulaciones, herramientas para docentes y vídeos.
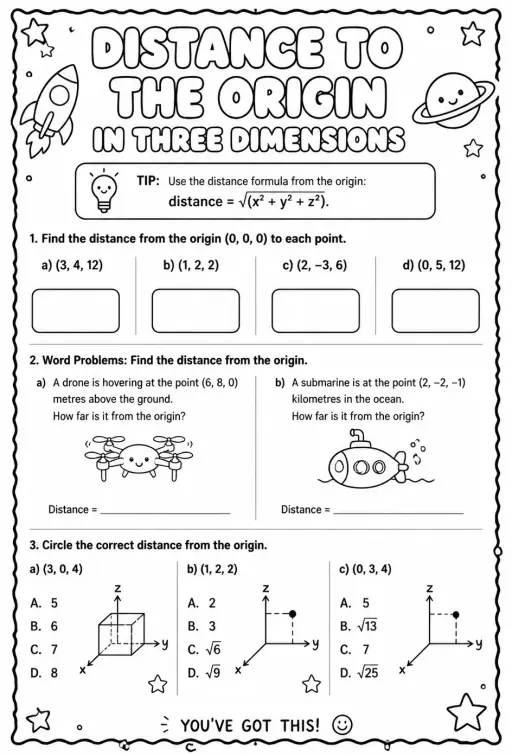
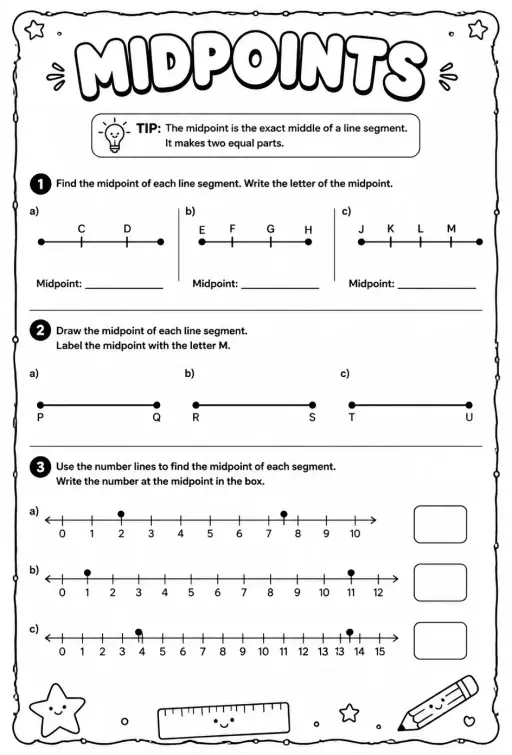

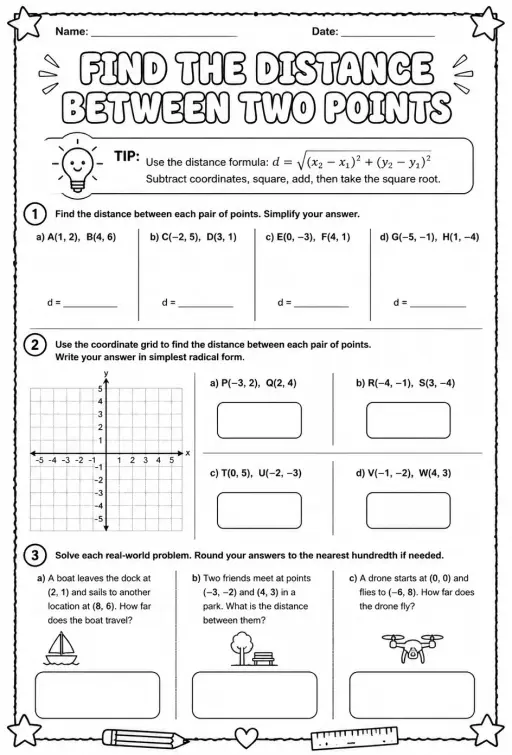

Sobre esta simulación
3D Point Plotter lets students move a red point P and a teal point Q inside a coordinate box with x, y and z axes. A Drag plane menu chooses the floor, wall or side plane, and the third coordinate stays fixed while dragging. Coordinates snap to half units between -5 and 5. Readouts show P, Q, the distance OP, the distance PQ and the midpoint M, and projection lines drop to the planes. It is a good first look at three-dimensional coordinates and at extending the distance and midpoint formulas to space.
Qué pueden explorar los alumnos
- Drag the red ball on the floor plane and note how x and z change while y stays the same.
- Change Drag plane to XY (wall) and drag again to see which coordinate is now fixed.
- Turn on the second point Q and read Distance PQ as you move it away from P.
- Place P and Q so the midpoint M has whole-number coordinates and check the readout.
- Toggle Projection lines to see how each coordinate is measured from the planes.
Objetivos de aprendizaje
- 1Read and plot a point using three coordinates (x, y, z).
- 2Describe how moving in one plane keeps the third coordinate fixed.
- 3Calculate distance between two points in space and check it with the readout.
- 4Find the midpoint of a segment by averaging each coordinate.
Preguntas frecuentes de los docentes
Is it free?
Yes, it costs nothing and needs no account. Open it in any current browser on a whiteboard, tablet, Chromebook or phone and it just works.
How is distance in 3D calculated?
Take the square root of the sum of the squared differences in x, y and z. It is Pythagoras applied twice, first on the floor and then upward with the height.
Which axis is which color?
The x axis is red, the y axis is green and the z axis is blue. In this simulation the floor is the XZ plane and y is the height.
How do I move a point in the third direction?
Switch the Drag plane menu to a different plane. Each plane lets the point slide in two directions, so using two planes lets you reach any position.
Insertar esta simulación
Colócala en tu LMS, blog o sitio de clase, gratis.
<iframe src="https://kiwibee.io/es/simulations/3d-point-plotter-3d-simulation/embed" title="3D Point Plotter | KiwiBee" loading="lazy" allowfullscreen style="width:100%;height:min(70vh,620px);min-height:420px;border:0;border-radius:16px"></iframe>Estándares curriculares
Cambridge
- 9Gp.02Use knowledge of coordinates to find points on a line segment.Cambridge Lower Secondary Mathematics (0862) — Stage 9 › Geometry and Measure › Position and transformation
Learning objectives © UCLES (Cambridge University Press & Assessment), quoted with attribution.
Lleva la ciencia interactiva a tu aula
El espacio de trabajo gratuito para docentes de KiwiBee reúne en un solo lugar la planificación de clases, las fichas, las herramientas de aula y el libro de calificaciones.
Empieza gratis y crea tu primera claseMira KiwiBee en YouTube
Vídeos cortos de KiwiBee para docentes y centros. Suscríbete o sigue a KiwiBee donde estés.
 Inicio
 Todas las soluciones
 Precios
 Quiénes somos
 KiwiBee para organizaciones sin fines de lucro
 Eventos y seminarios web
 Para grandes organizaciones
 Para escuelas
 Para centros de aprendizaje
 Para líderes de equipo
 Para docentes
 Recursos
 Hojas de trabajo imprimibles
 Simulaciones interactivas
 Herramientas para docentes
 Ideas e investigación


