Show data in different ways
Free printable Grade 1 math worksheet for "Show data in different ways" — practice data and graphs. No-prep, print or assign online.
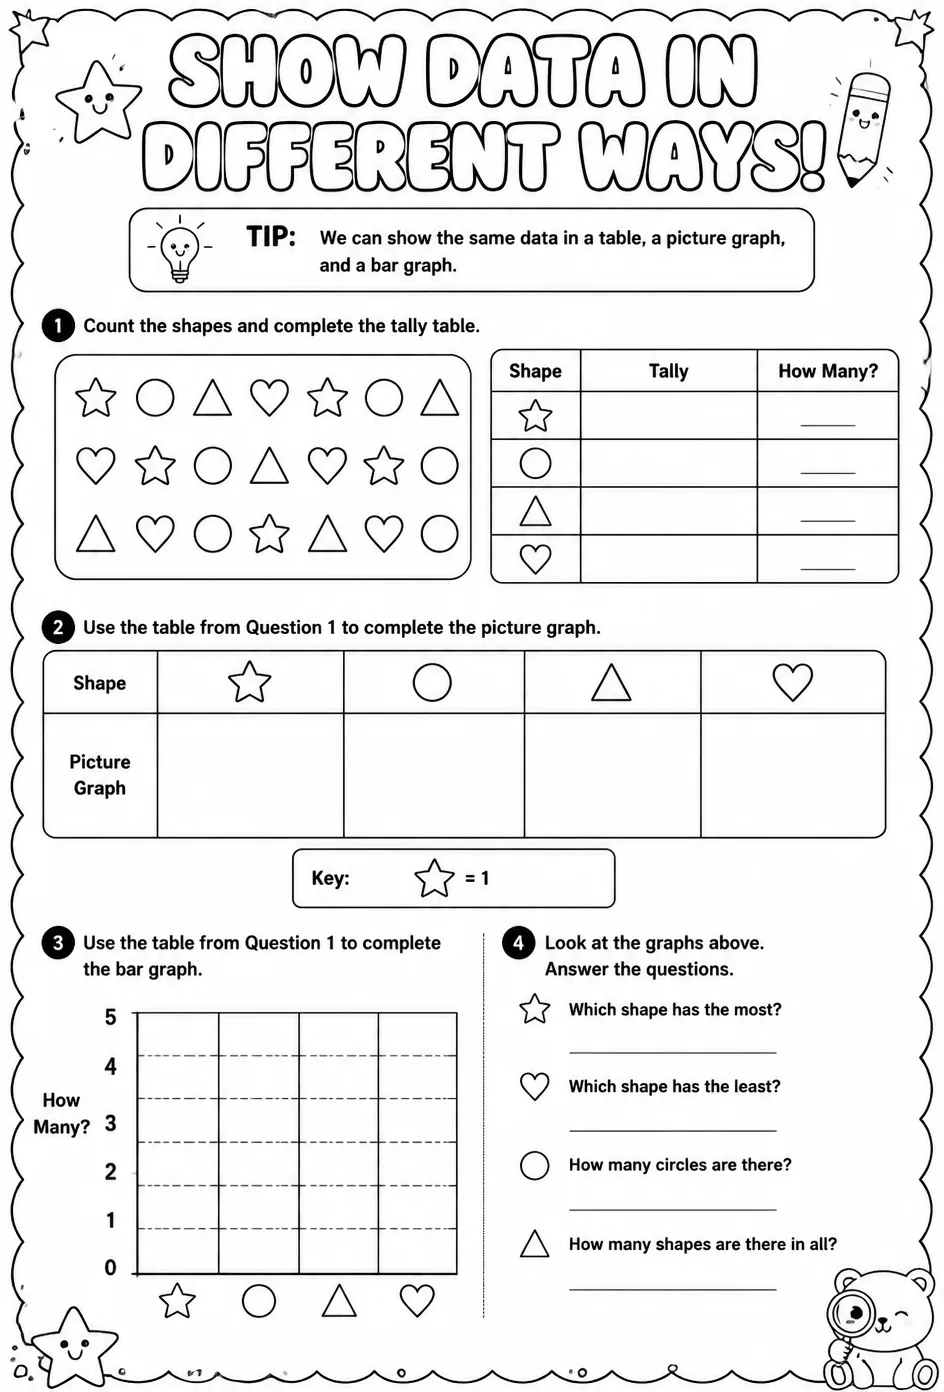
This worksheet helps first-grade students explore data representation through pictographs and bar graphs. Teachers can use it to reinforce skills in organizing and interpreting data in various formats. It supports lessons on data and graphs by encouraging students to visualize and compare information effectively.
Learning objectives
- Interpret data by identifying information presented in different types of graphs
- Organize simple data sets into pictographs and bar graphs
- Compare data using visual representations to answer questions
How to use this worksheet
- Click “Download Worksheet” and sign in with Google or email to get the PDF instantly.
- Print at home or in class for Grade 1; it's no-prep, with no extra materials needed.
- Hand it out as classwork, homework, or a quick warm-up.
Frequently asked questions
Is the “Show data in different ways” worksheet free?
Yes. “Show data in different ways” is a free printable Math worksheet. Sign in with Google or email to download the PDF instantly.
What grade or age is this Math worksheet for?
It's designed for Grade 1 (ages 6–7), covering Data and graphs.
Do I need to prep anything?
No. It's a no-prep, print-and-go worksheet — just download and hand it out.
Create more worksheets in our Worksheet Studio
Generate fresh worksheets for any grade, topic, and language — free.
Open the Worksheet StudioMore for Grade 1

You might also like
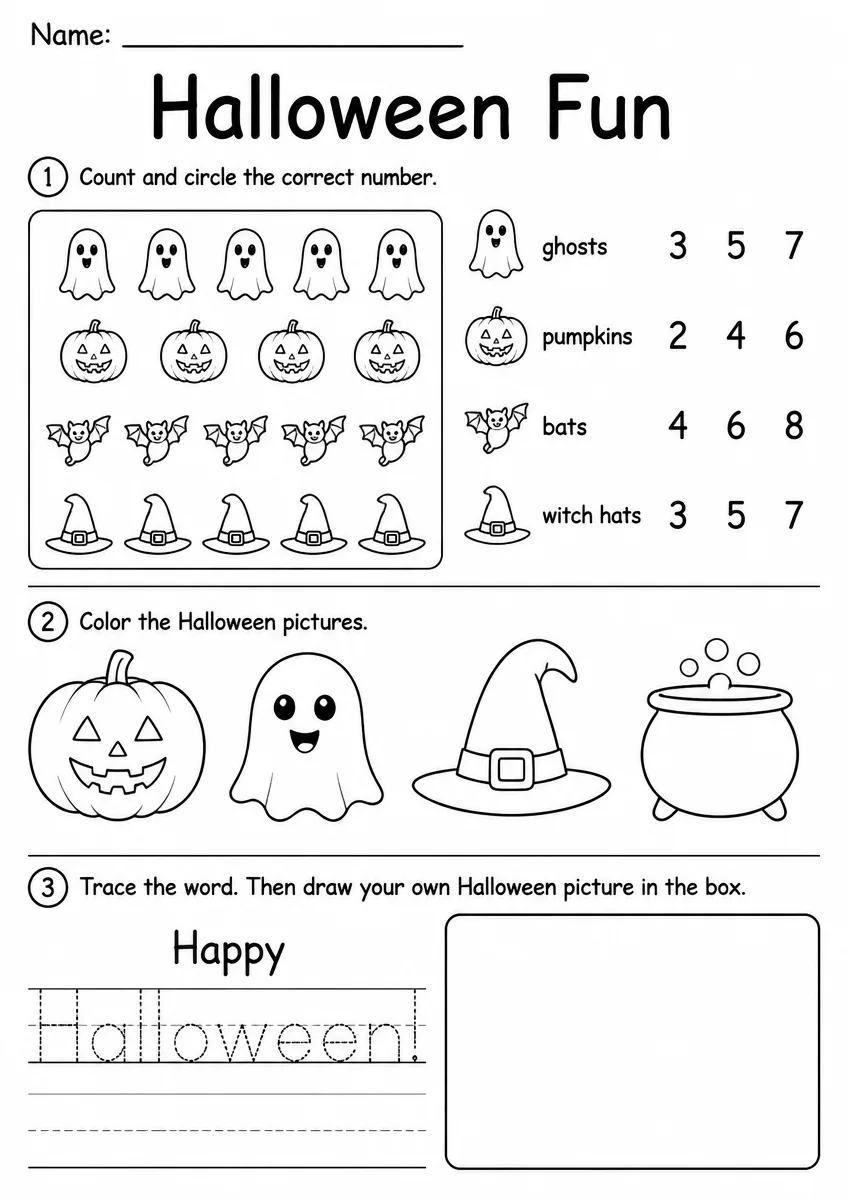
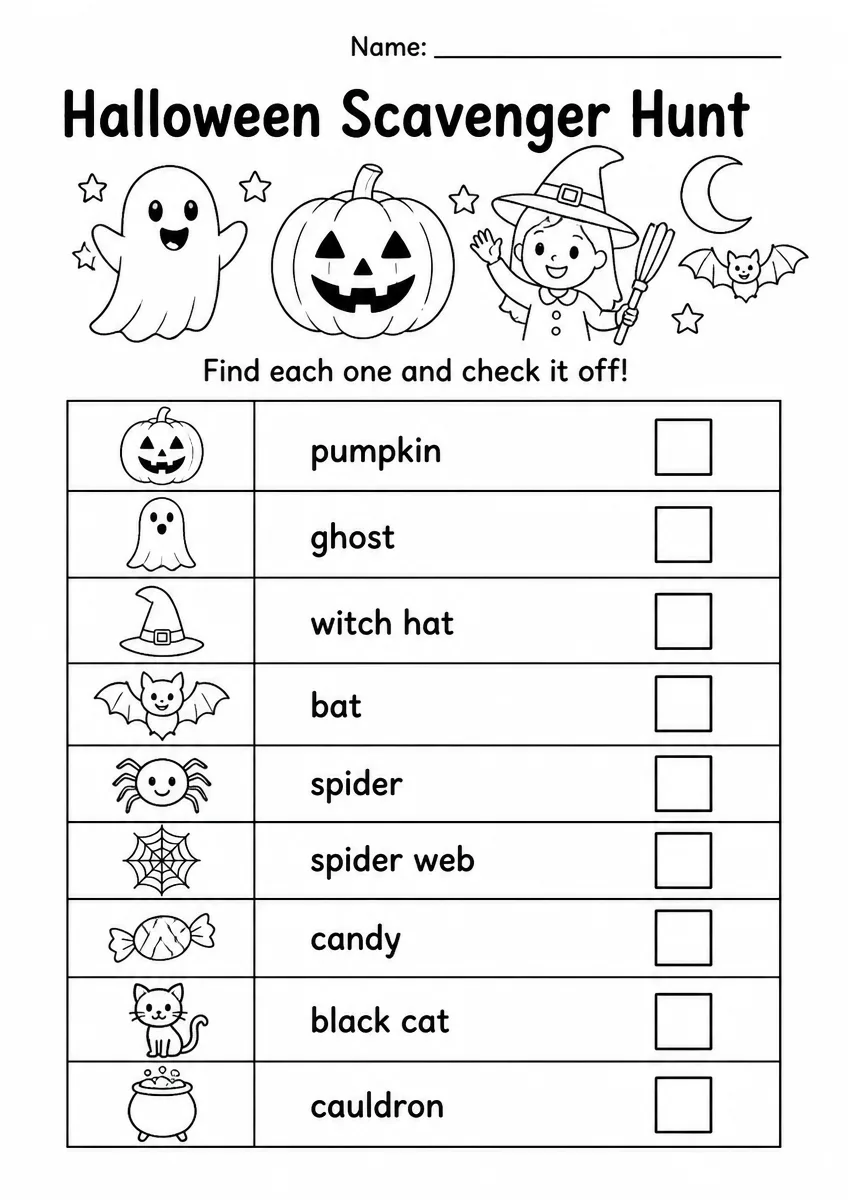
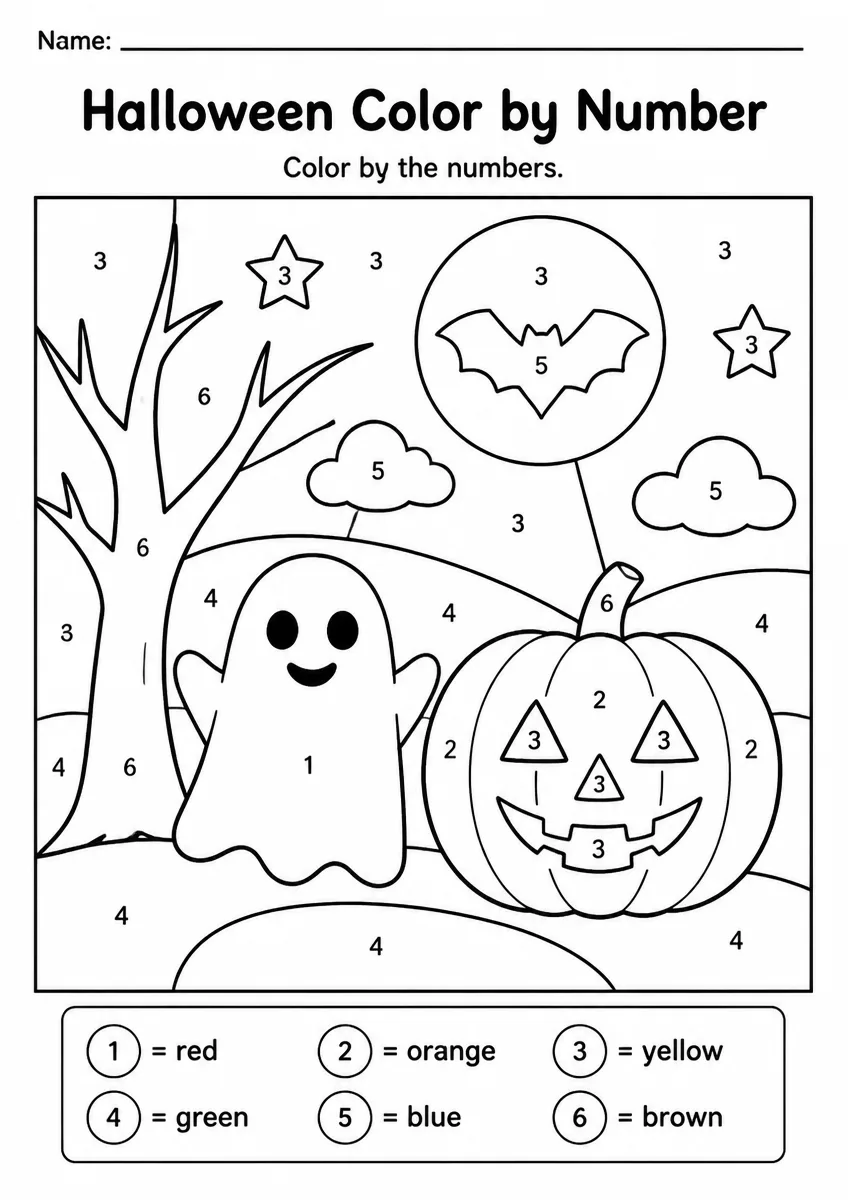
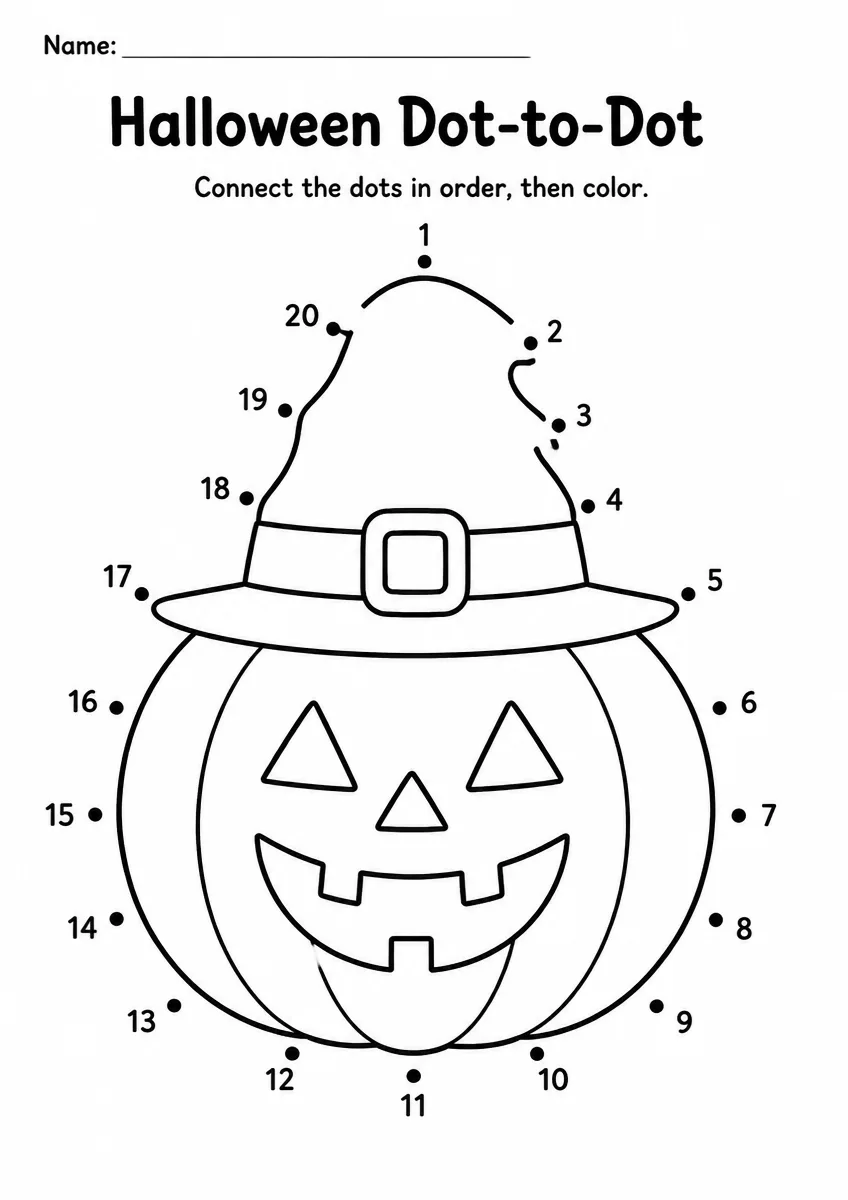
Halloween Worksheet — Grade 1
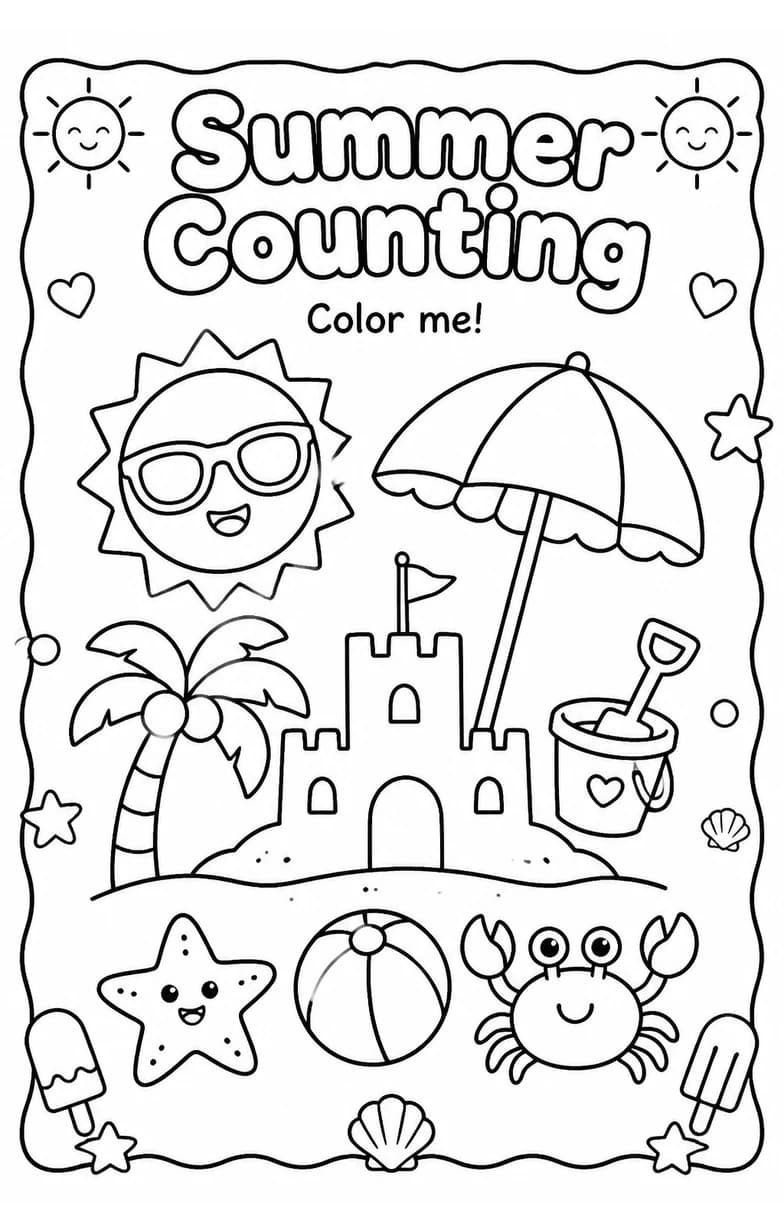
Summer Counting Coloring Page
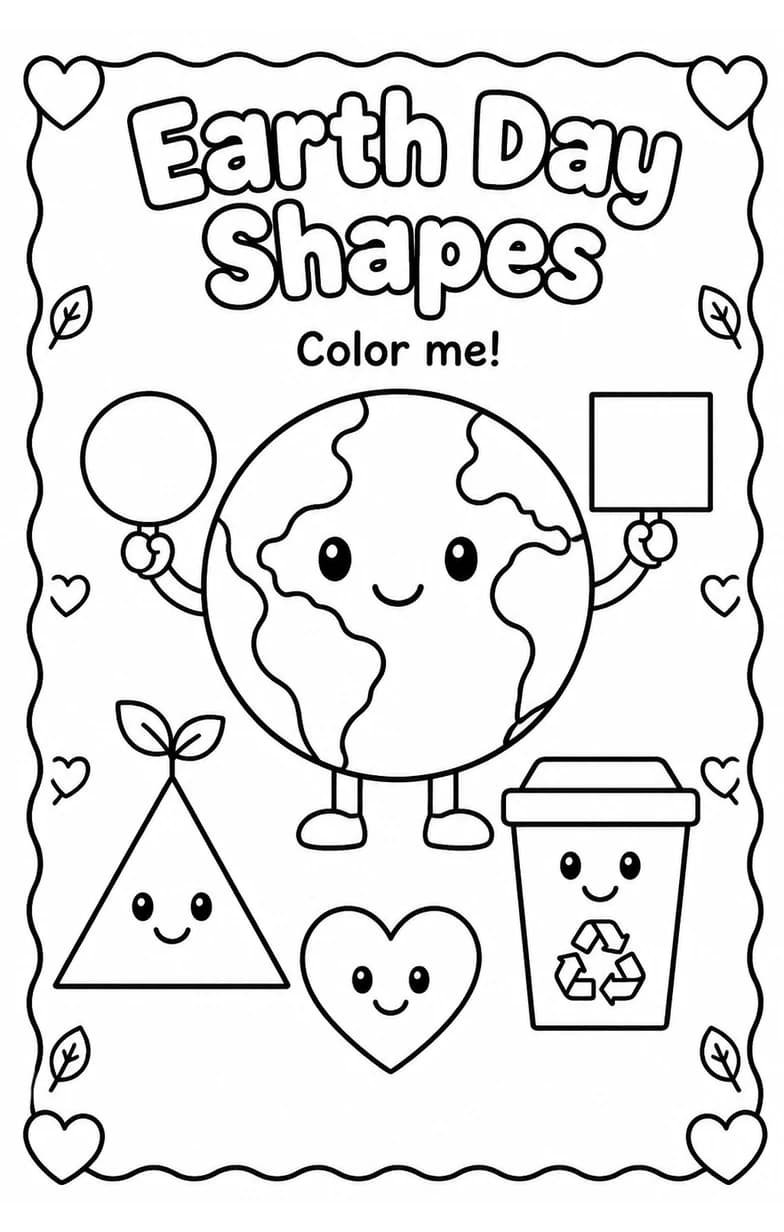
Earth Day Shapes Coloring Page
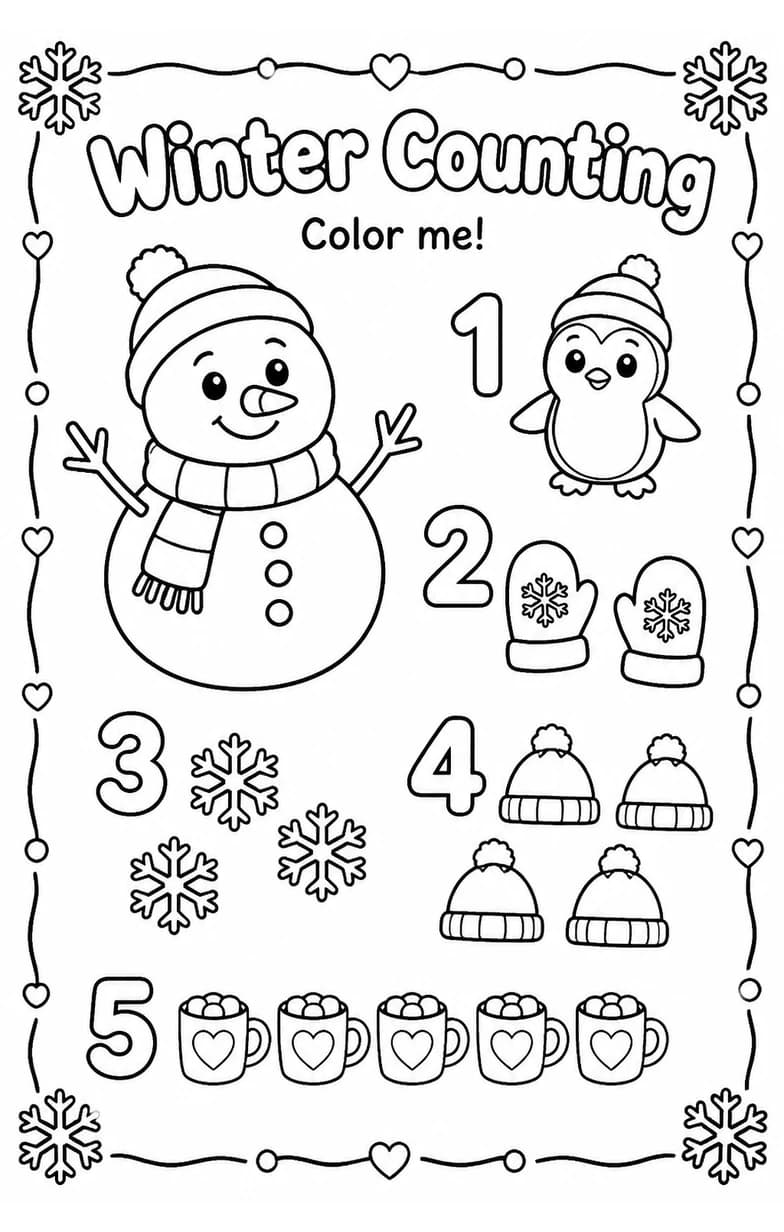
Winter Counting Coloring Page
Valentine's Day Worksheet — Grade 1
