Interpret bar graphs, line graphs, and histograms
Free printable Algebra 1 math worksheet for "Interpret bar graphs, line graphs, and histograms" — practice data and graphs. No-prep, print or assign online.
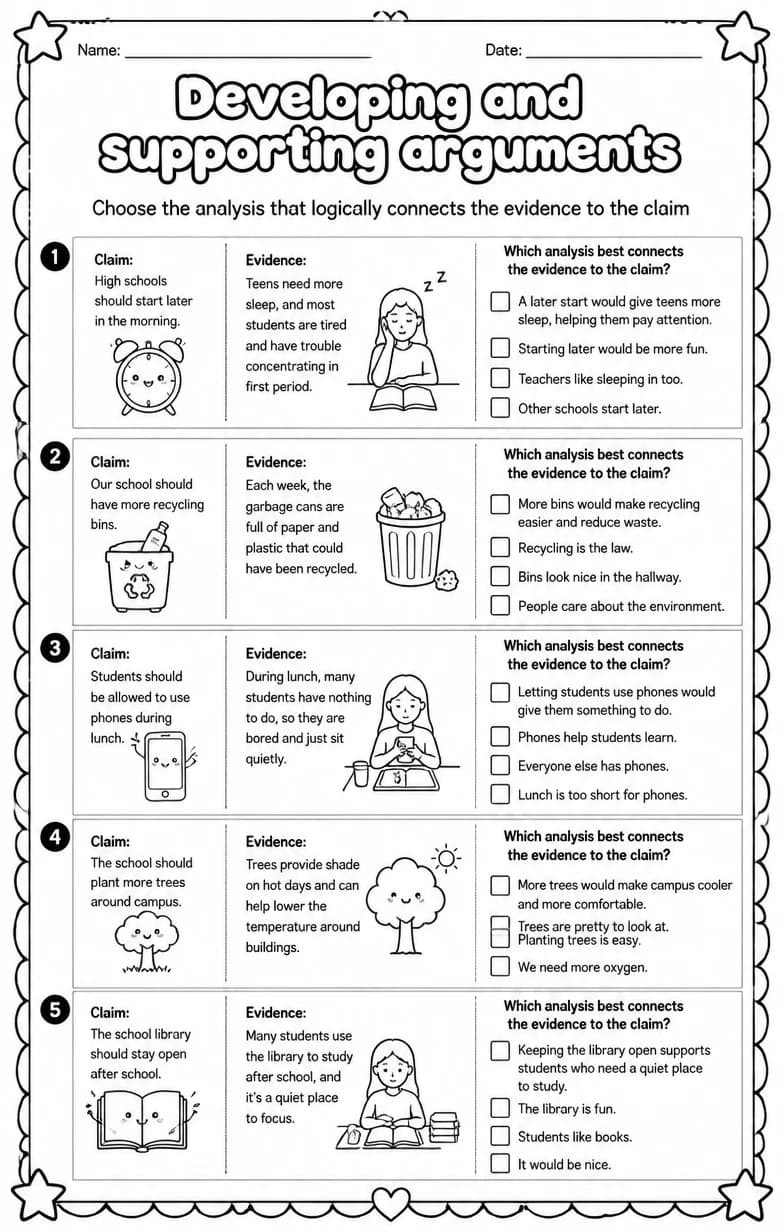
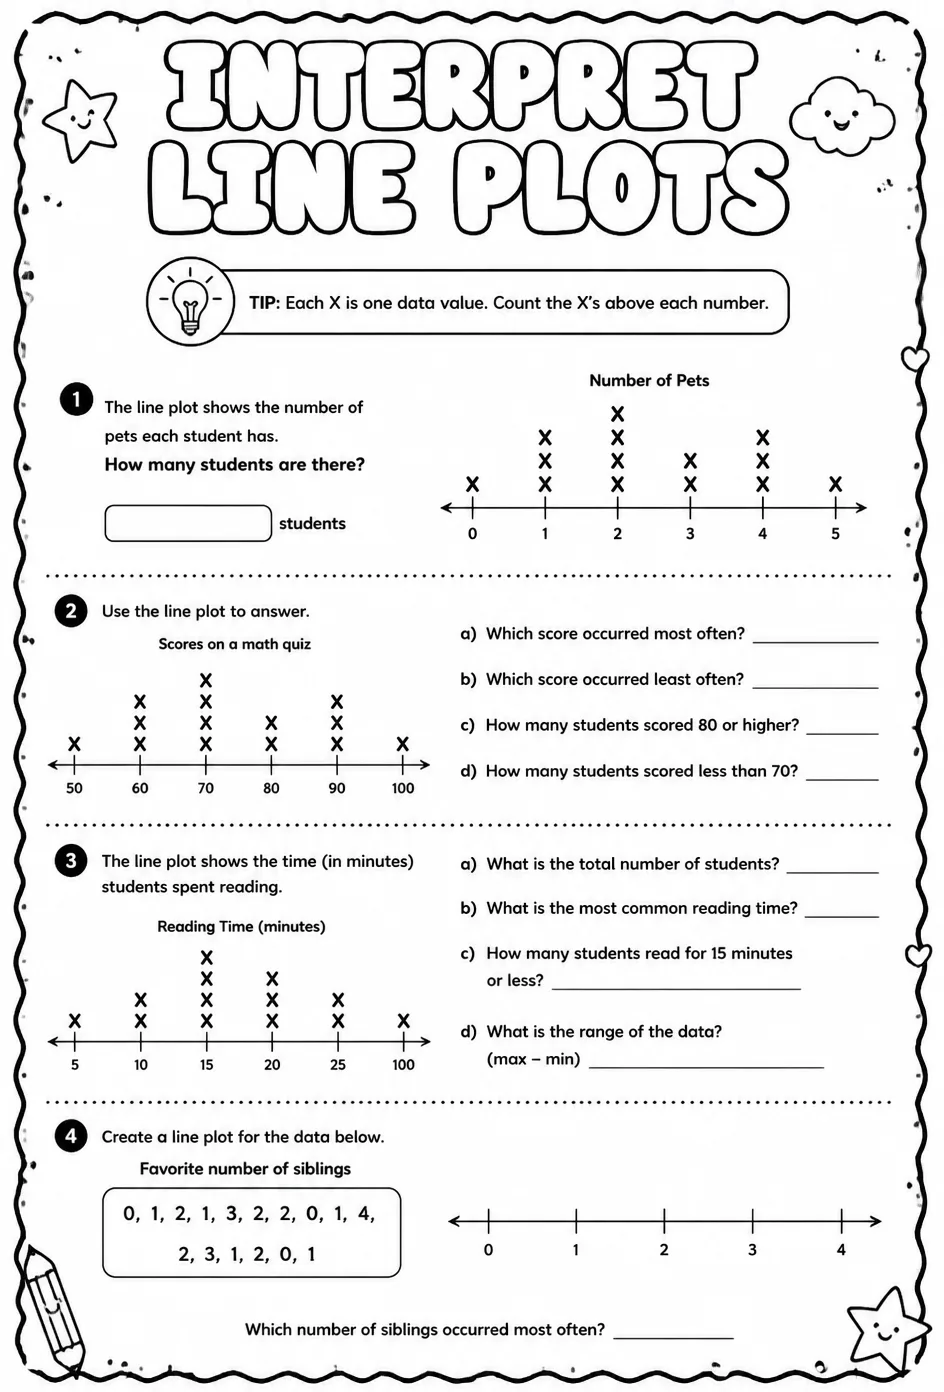
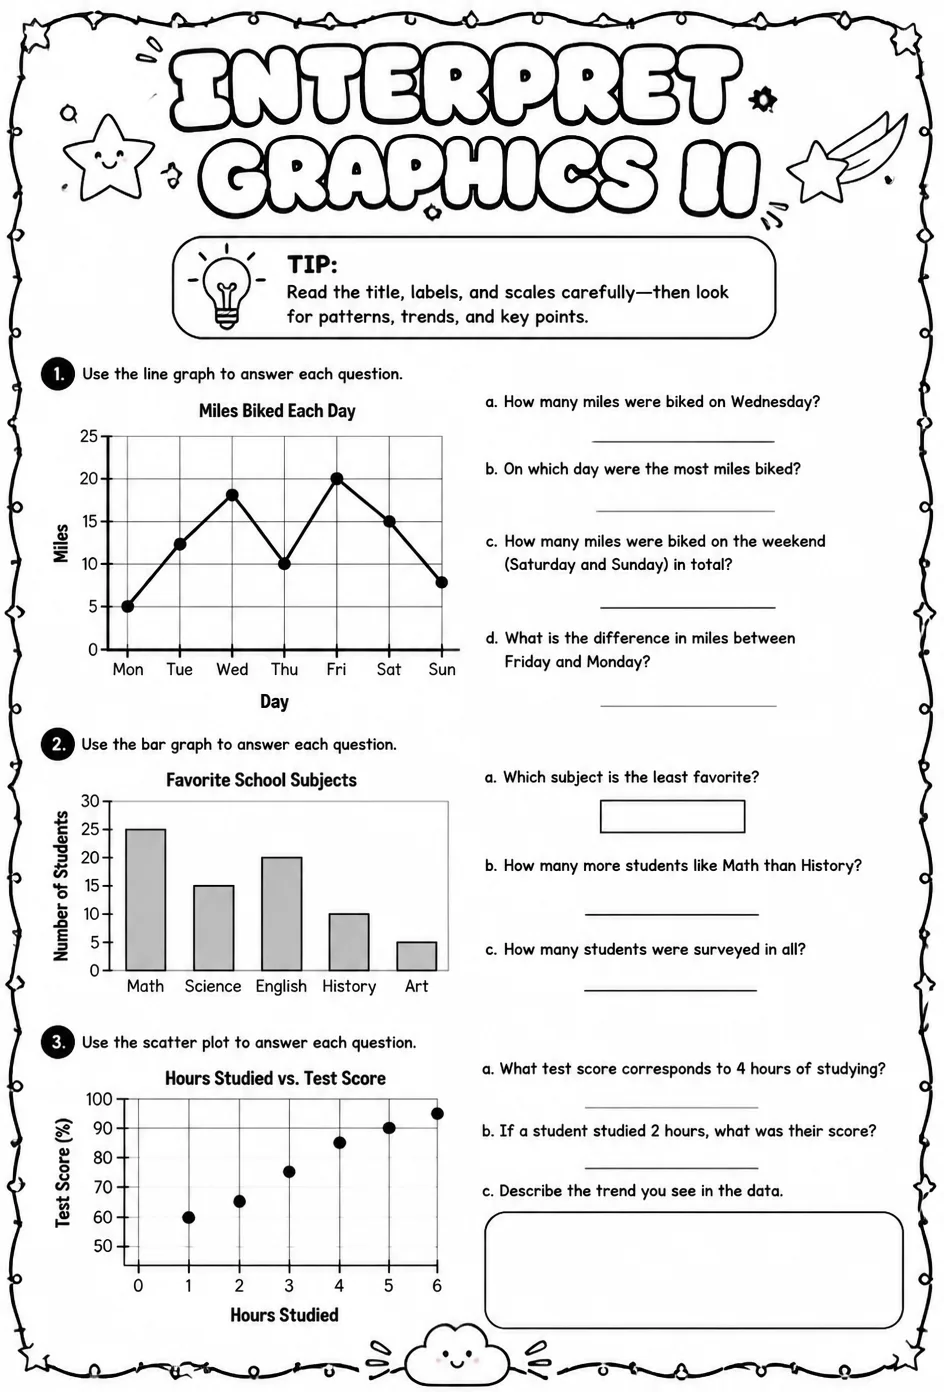
This worksheet provides high school students with challenging practice interpreting bar graphs, line graphs, and histograms. Teachers can use it to reinforce data analysis skills and help students understand how to extract meaningful information from different graphical representations. It supports lessons on data interpretation, graph reading, and statistical reasoning.
Learning objectives
- Analyze data presented in bar graphs, line graphs, and histograms to identify trends and patterns.
- Interpret the meaning of different graph components such as axes, scales, and data intervals.
- Compare and contrast information displayed across various graph types to draw conclusions.
How to use this worksheet
- Click “Download Worksheet” and sign in with Google or email to get the PDF instantly.
- Print at home or in class for High School; it's no-prep, with no extra materials needed.
- Hand it out as classwork, homework, or a quick warm-up.
Frequently asked questions
Is the “Interpret bar graphs, line graphs, and histograms” worksheet free?
Yes. “Interpret bar graphs, line graphs, and histograms” is a free printable Math worksheet. Sign in with Google or email to download the PDF instantly.
What grade or age is this Math worksheet for?
It's designed for High School (ages 14–18), covering Data and graphs.
Do I need to prep anything?
No. It's a no-prep, print-and-go worksheet — just download and hand it out.
Create more worksheets in our Worksheet Studio
Generate fresh worksheets for any grade, topic, and language — free.
Open the Worksheet Studio