Create line plots with fractions
Free printable Grade 3 math worksheet for "Create line plots with fractions" — practice data and graphs. No-prep, print or assign online.
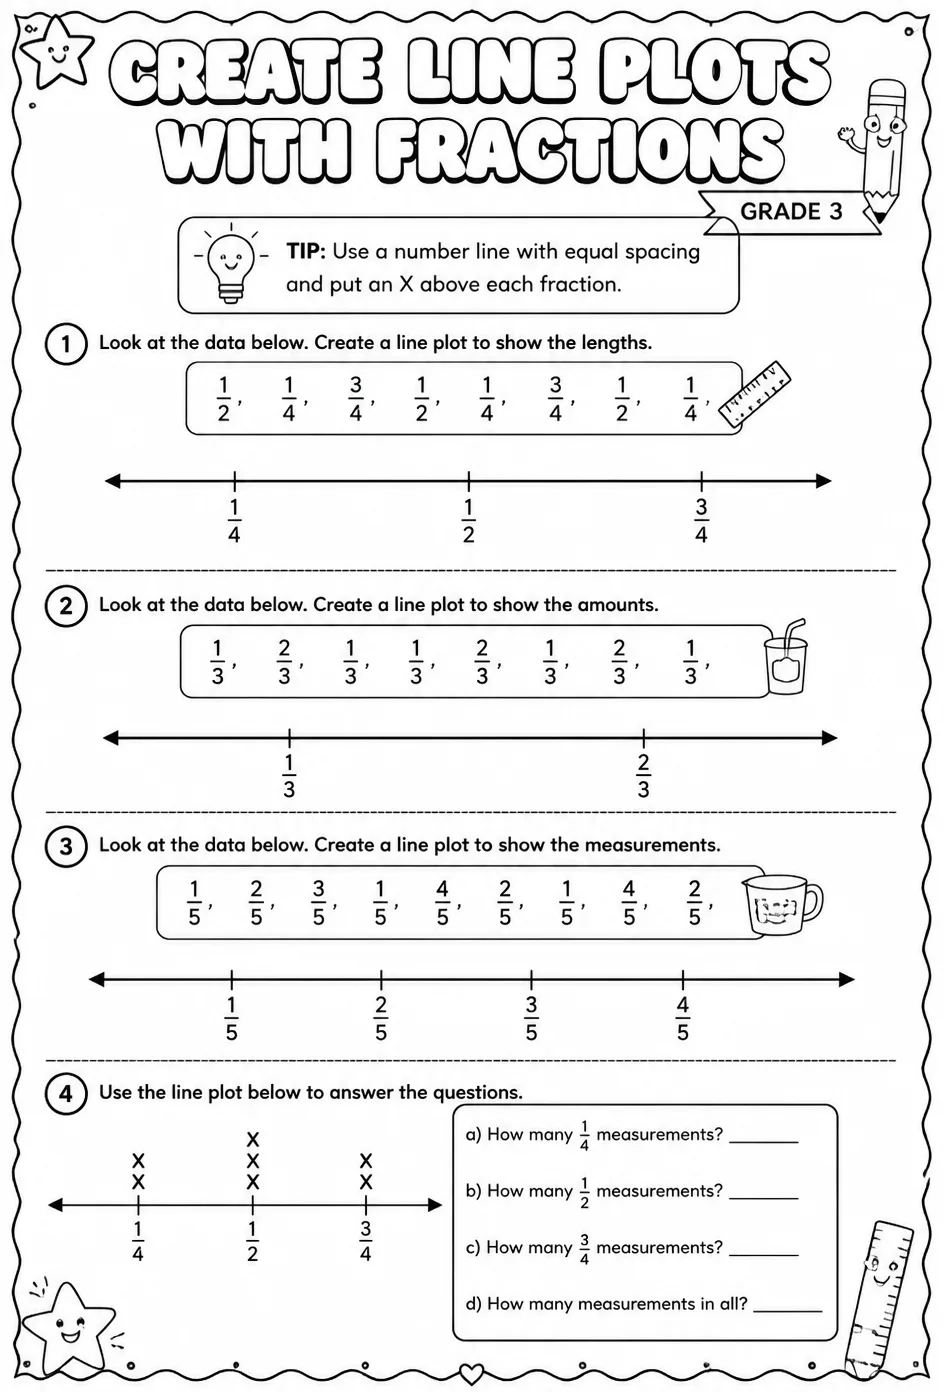
This worksheet provides practice for students to create and interpret line plots featuring fractional data points. Teachers can use it to reinforce understanding of fractions in the context of data visualization and to develop students' skills in organizing and analyzing fractional data. It is ideal for lessons on data and graphs, helping students build confidence in representing and reading fractional measurements on line plots.
Learning objectives
- Interpret and plot fractional data points on a line plot.
- Create line plots using fractions to represent data values accurately.
- Analyze line plots with fractions to answer questions about data distribution.
How to use this worksheet
- Click “Download Worksheet” and sign in with Google or email to get the PDF instantly.
- Print at home or in class for Grade 3; it's no-prep, with no extra materials needed.
- Hand it out as classwork, homework, or a quick warm-up.
Frequently asked questions
Is the “Create line plots with fractions” worksheet free?
Yes. “Create line plots with fractions” is a free printable Math worksheet. Sign in with Google or email to download the PDF instantly.
What grade or age is this Math worksheet for?
It's designed for Grade 3 (ages 8–9), covering Data and graphs.
Do I need to prep anything?
No. It's a no-prep, print-and-go worksheet — just download and hand it out.
Create more worksheets in our Worksheet Studio
Generate fresh worksheets for any grade, topic, and language — free.
Open the Worksheet StudioMore for Grade 3
You might also like
Thanksgiving Worksheet — Grade 3
Fractions Bingo — Grade 3 | Free Classroom Game
Fractions Jeopardy Review Game — Grade 3 | Free Classroom Game
