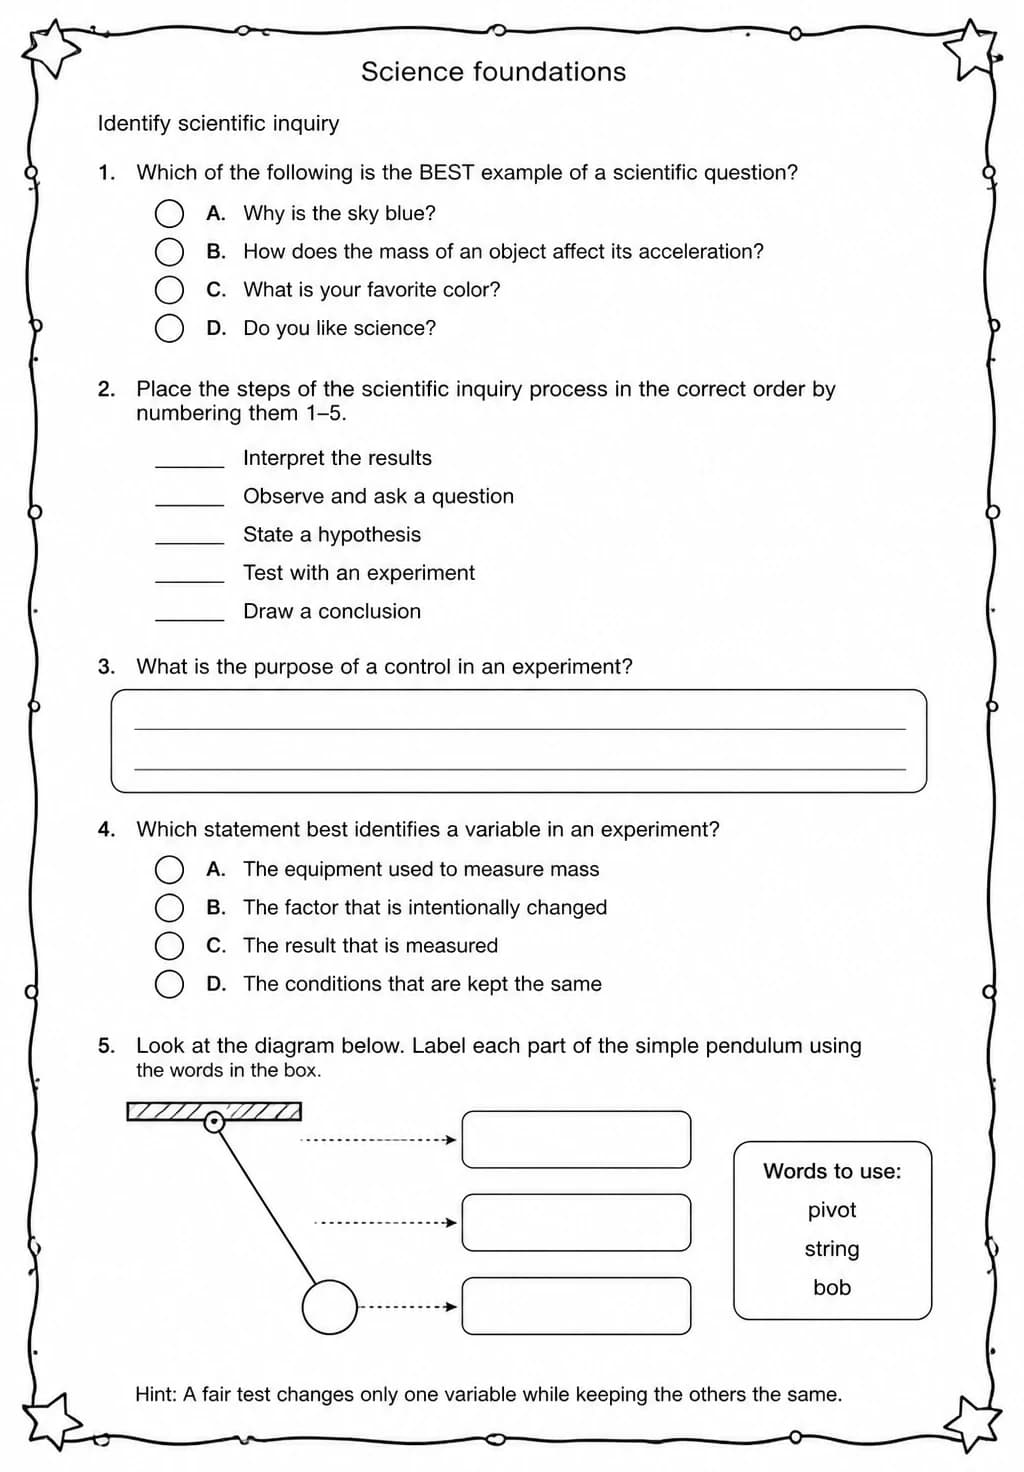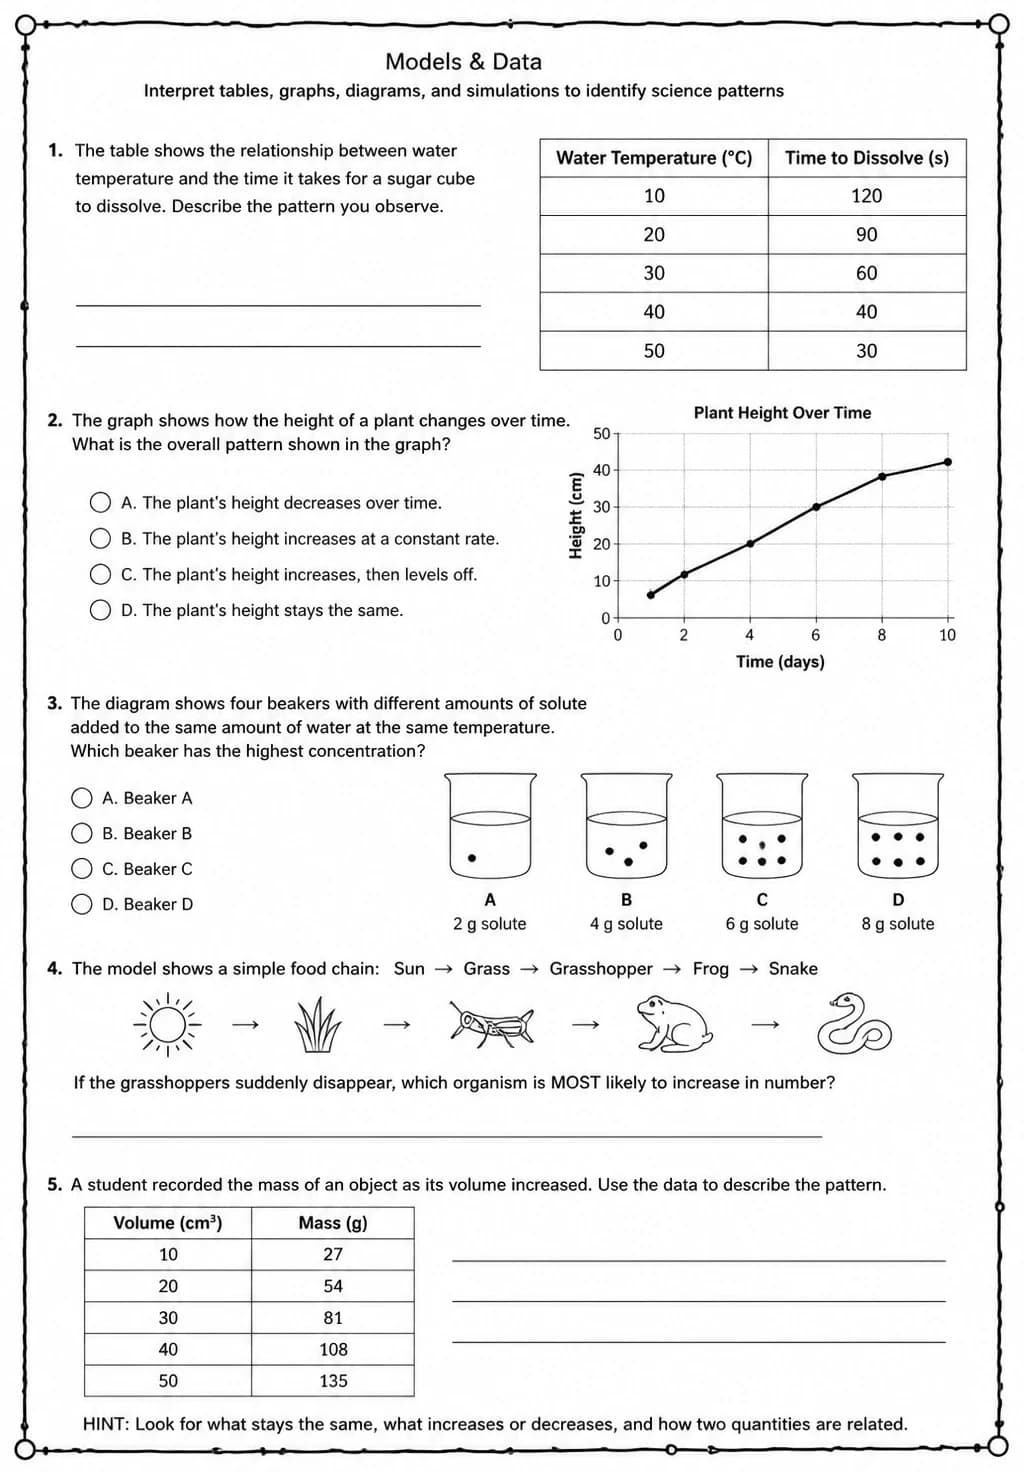
Interpret tables, graphs, diagrams, and simulations to identify science patterns
Free printable Science Literacy science worksheet for "Interpret tables, graphs, diagrams, and simulations to identify science patterns" — practice models & data. No-prep, print or assign online.
High school science students practice interpreting tables, graphs, diagrams, and simulations to identify patterns in data, a critical skill that runs across every scientific discipline. Teachers can use this worksheet as a standalone data-literacy exercise or embed it within any unit where students analyze experimental results or model outputs. Strong data interpretation skills directly support students in designing investigations and evaluating scientific claims.
Learning objectives
- Read and interpret scientific tables, graphs, and diagrams to extract key information
- Identify patterns and trends within data represented in different formats
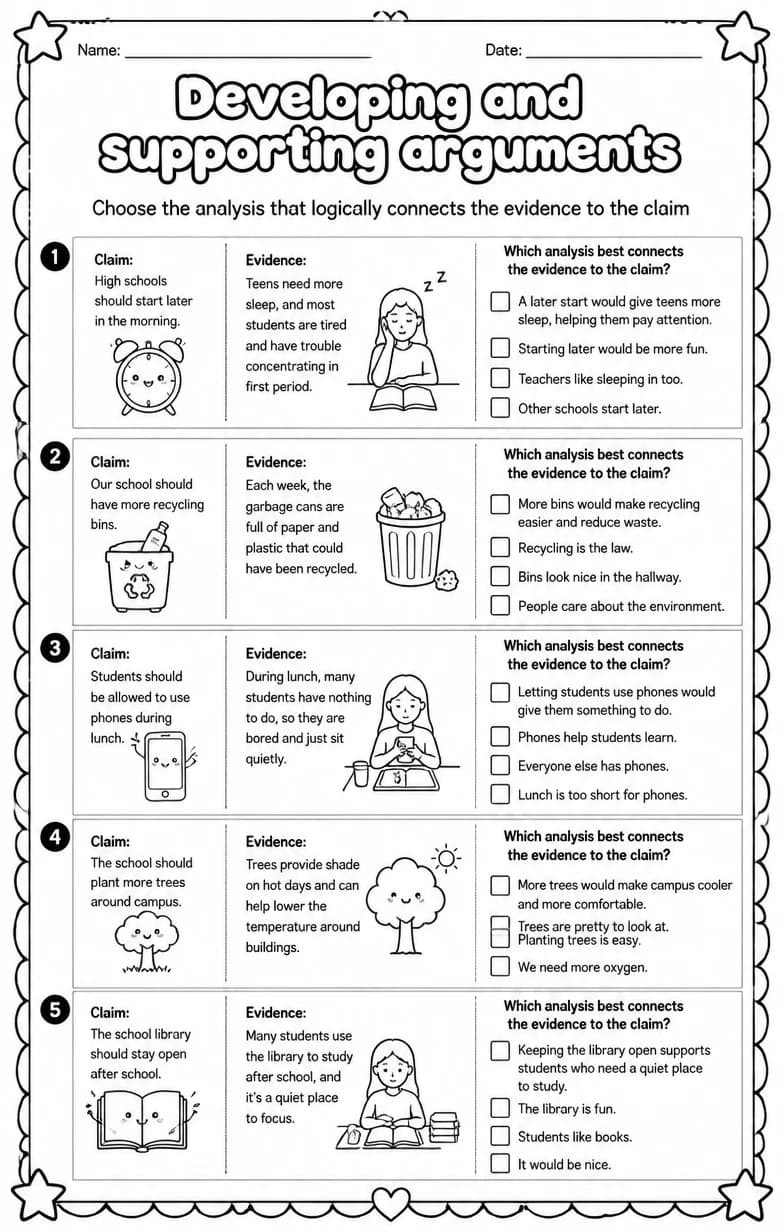
- Use evidence from data to support or challenge a scientific claim
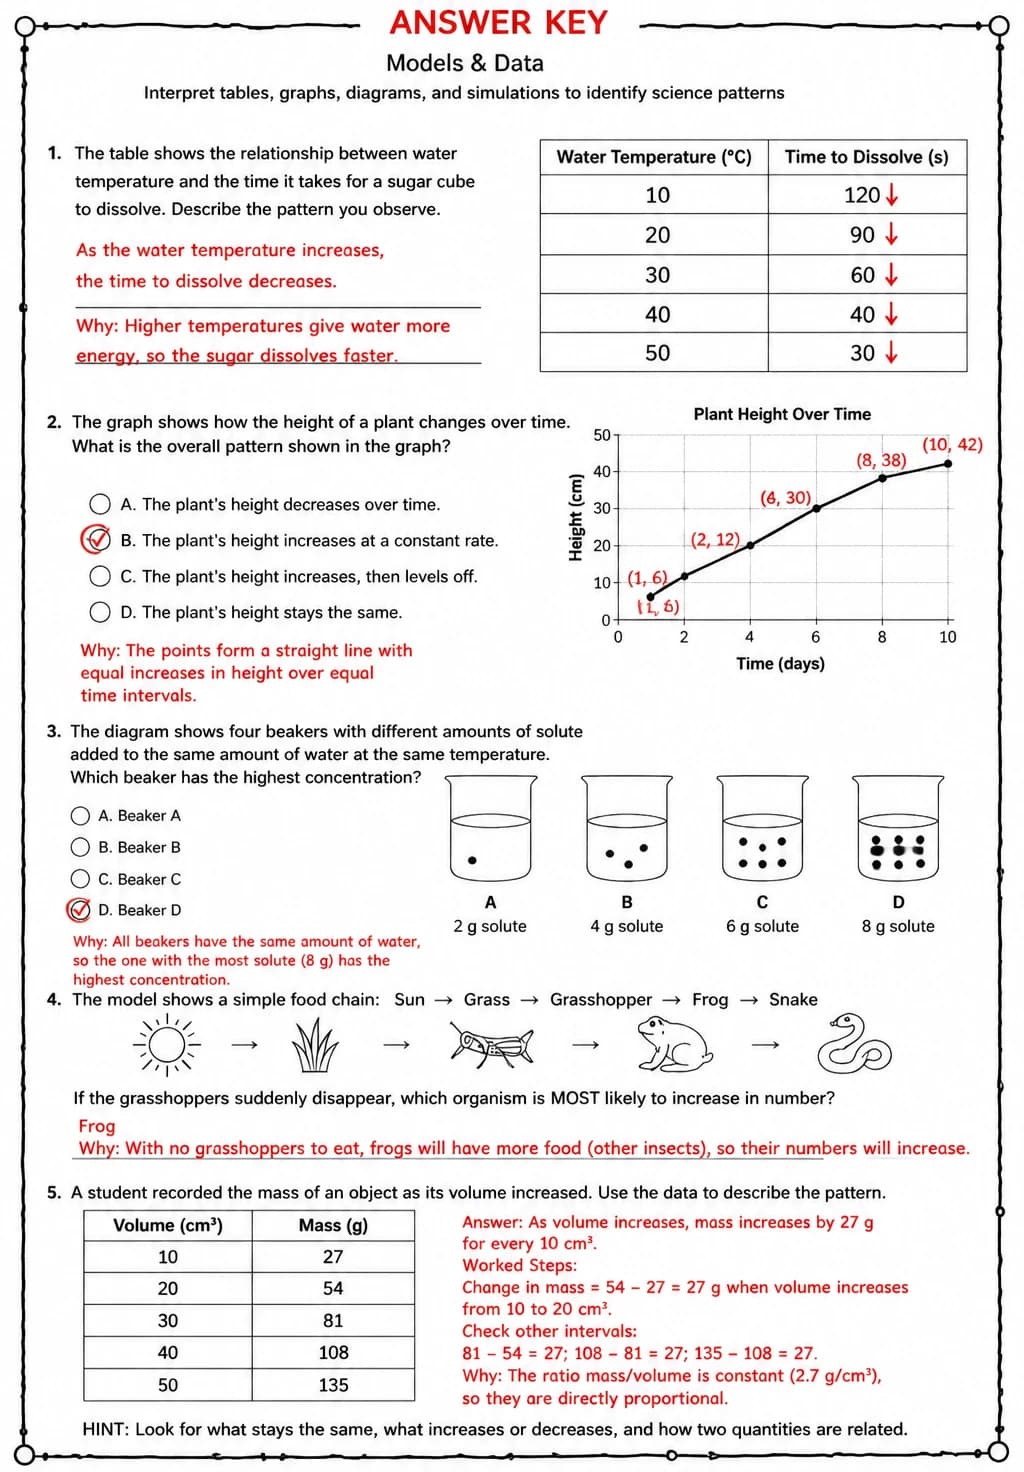
Answer Key
How to use this worksheet
- Click “Download Worksheet” and sign in with Google or email to get the PDF instantly.
- Print at home or in class for High School; it's no-prep, with no extra materials needed.
- Use the included answer key to mark it in seconds.
Frequently asked questions
Is the “Interpret tables, graphs, diagrams, and simulations to identify science patterns” worksheet free?
Yes. “Interpret tables, graphs, diagrams, and simulations to identify science patterns” is a free printable Science worksheet. Sign in with Google or email to download the PDF instantly.
What grade or age is this Science worksheet for?
It's designed for High School (ages 14–18), covering Models & Data.
Does it come with an answer key?
Yes — a matching answer key is included so you can grade it in seconds.
Create more worksheets in our Worksheet Studio
Generate fresh worksheets for any grade, topic, and language — free.
Open the Worksheet StudioMore for High School

You might also like
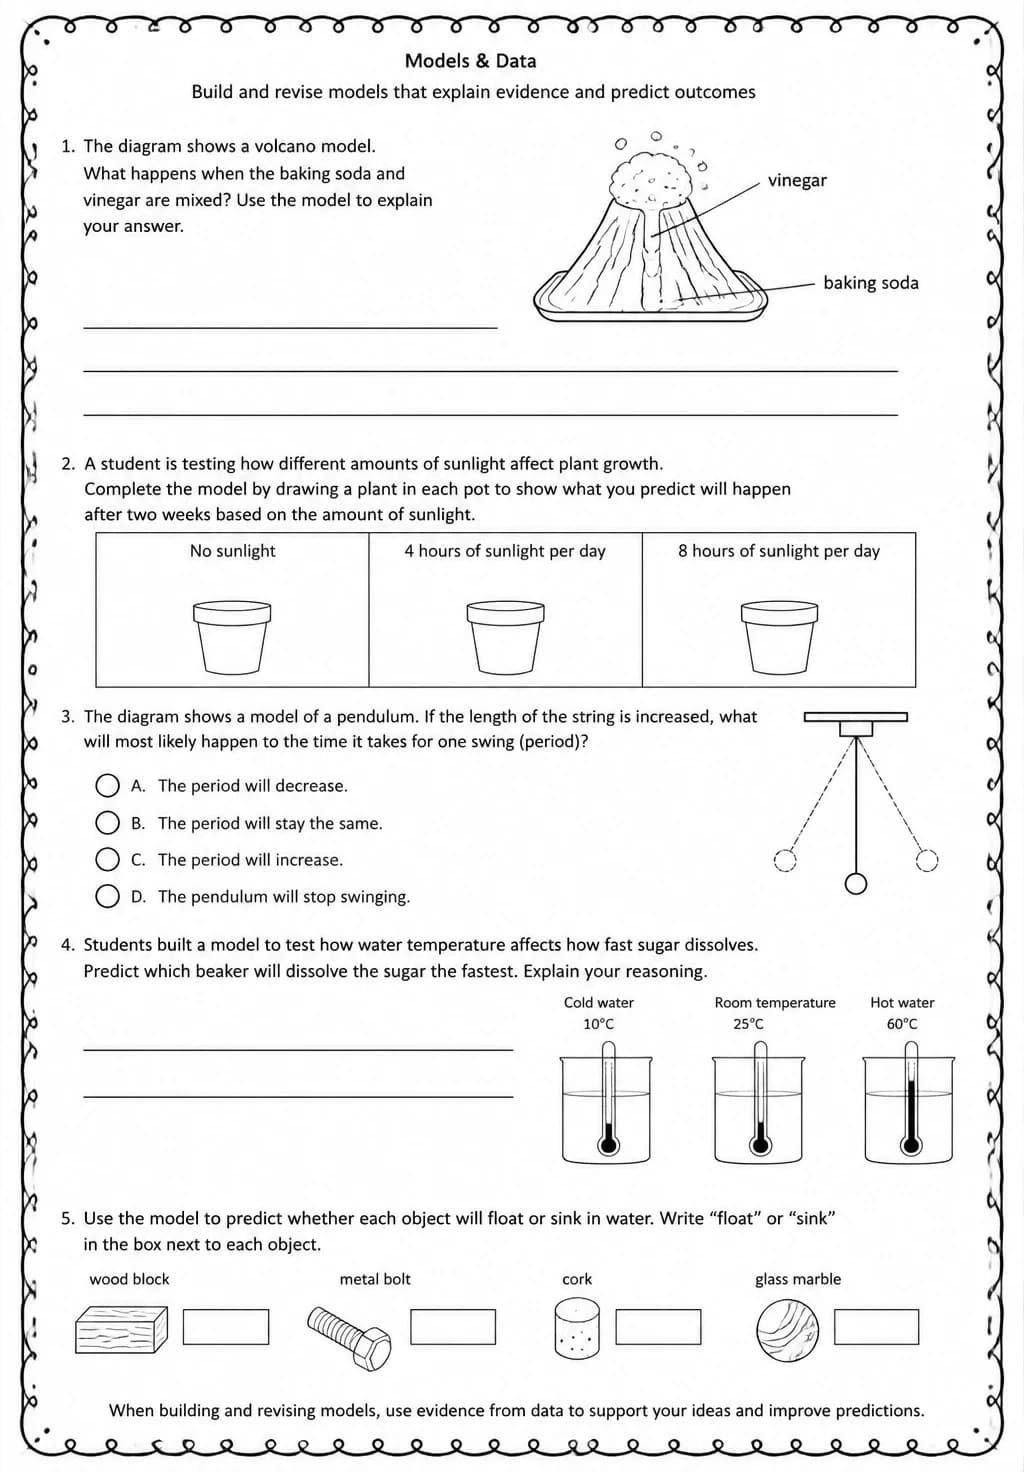
Build and revise models that explain evidence and predict outcomes
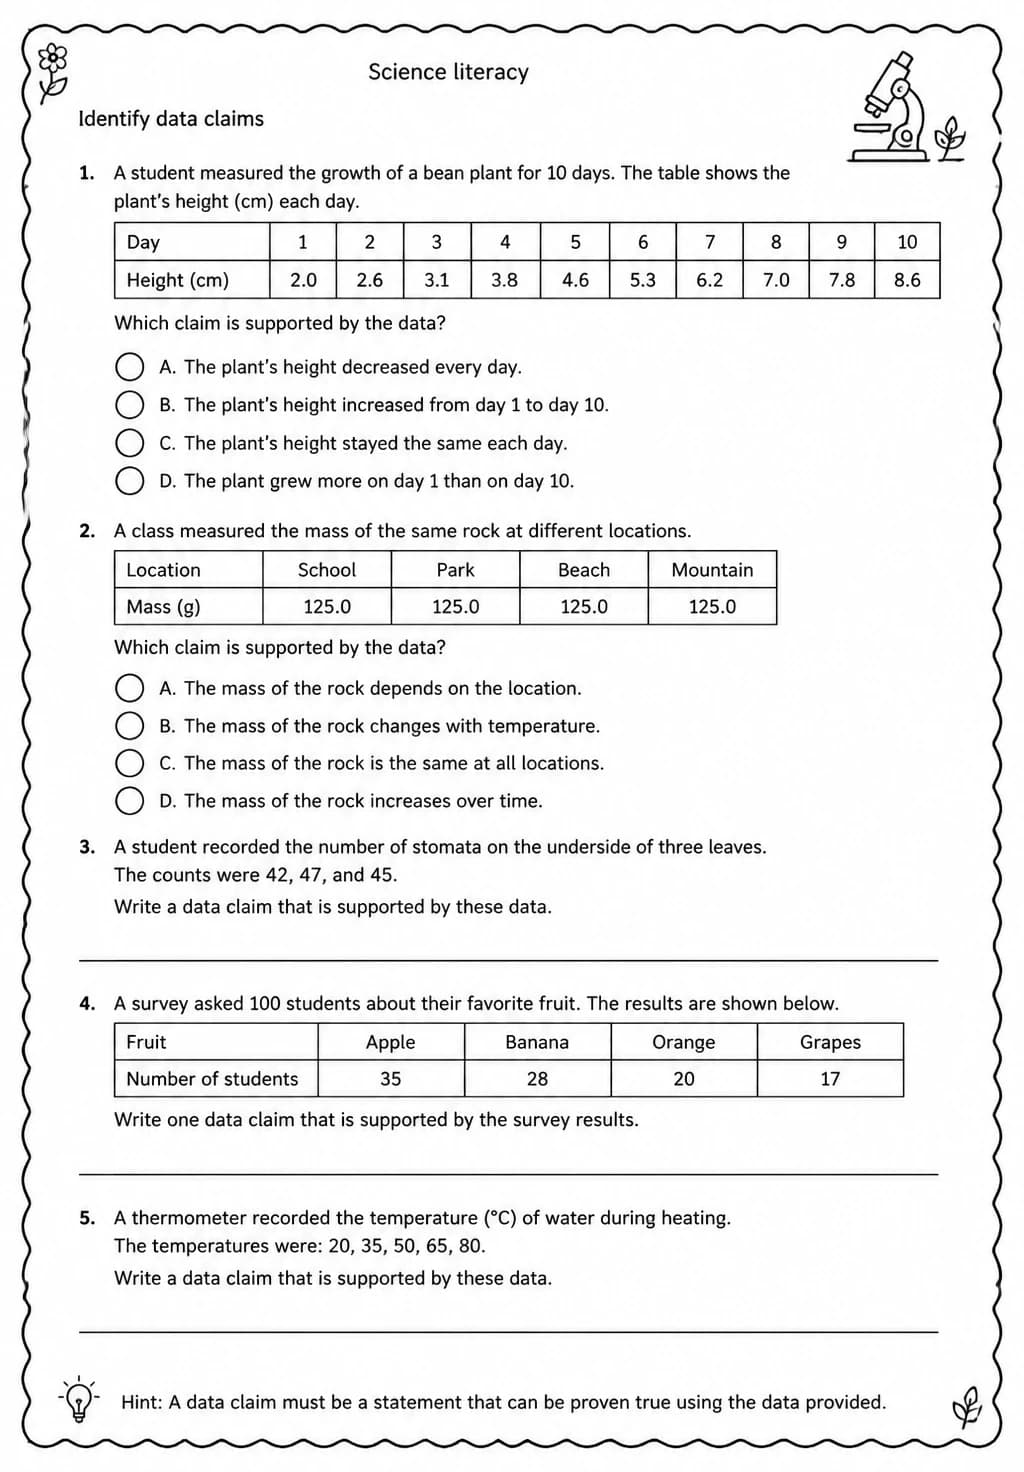
Identify data claims

Identify graphing data
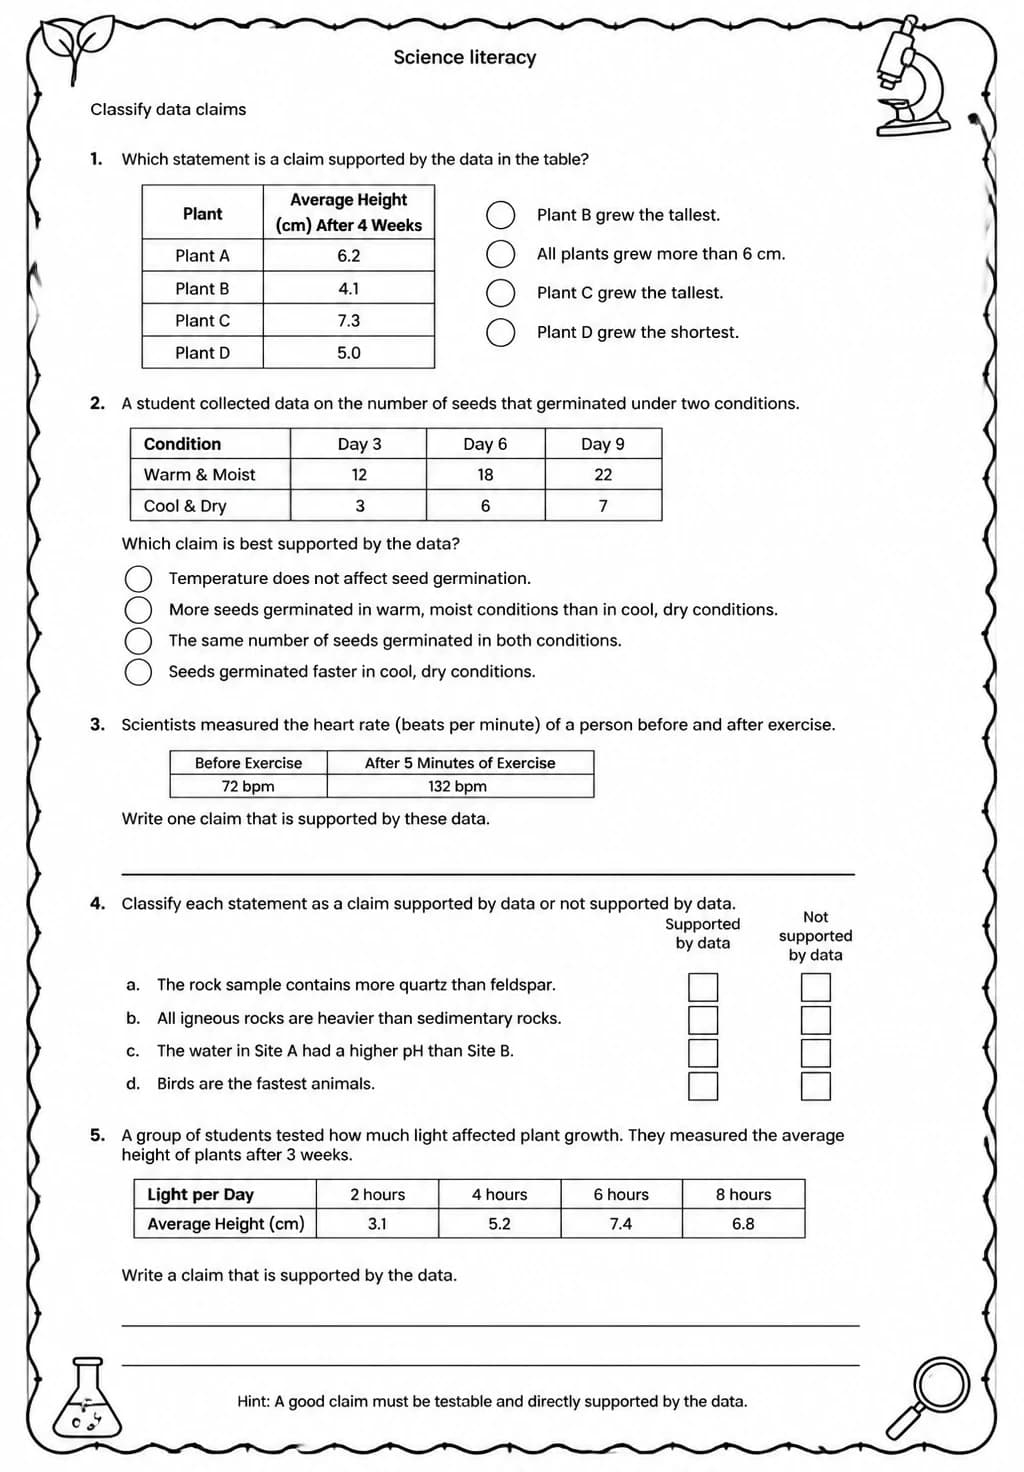
Classify data claims
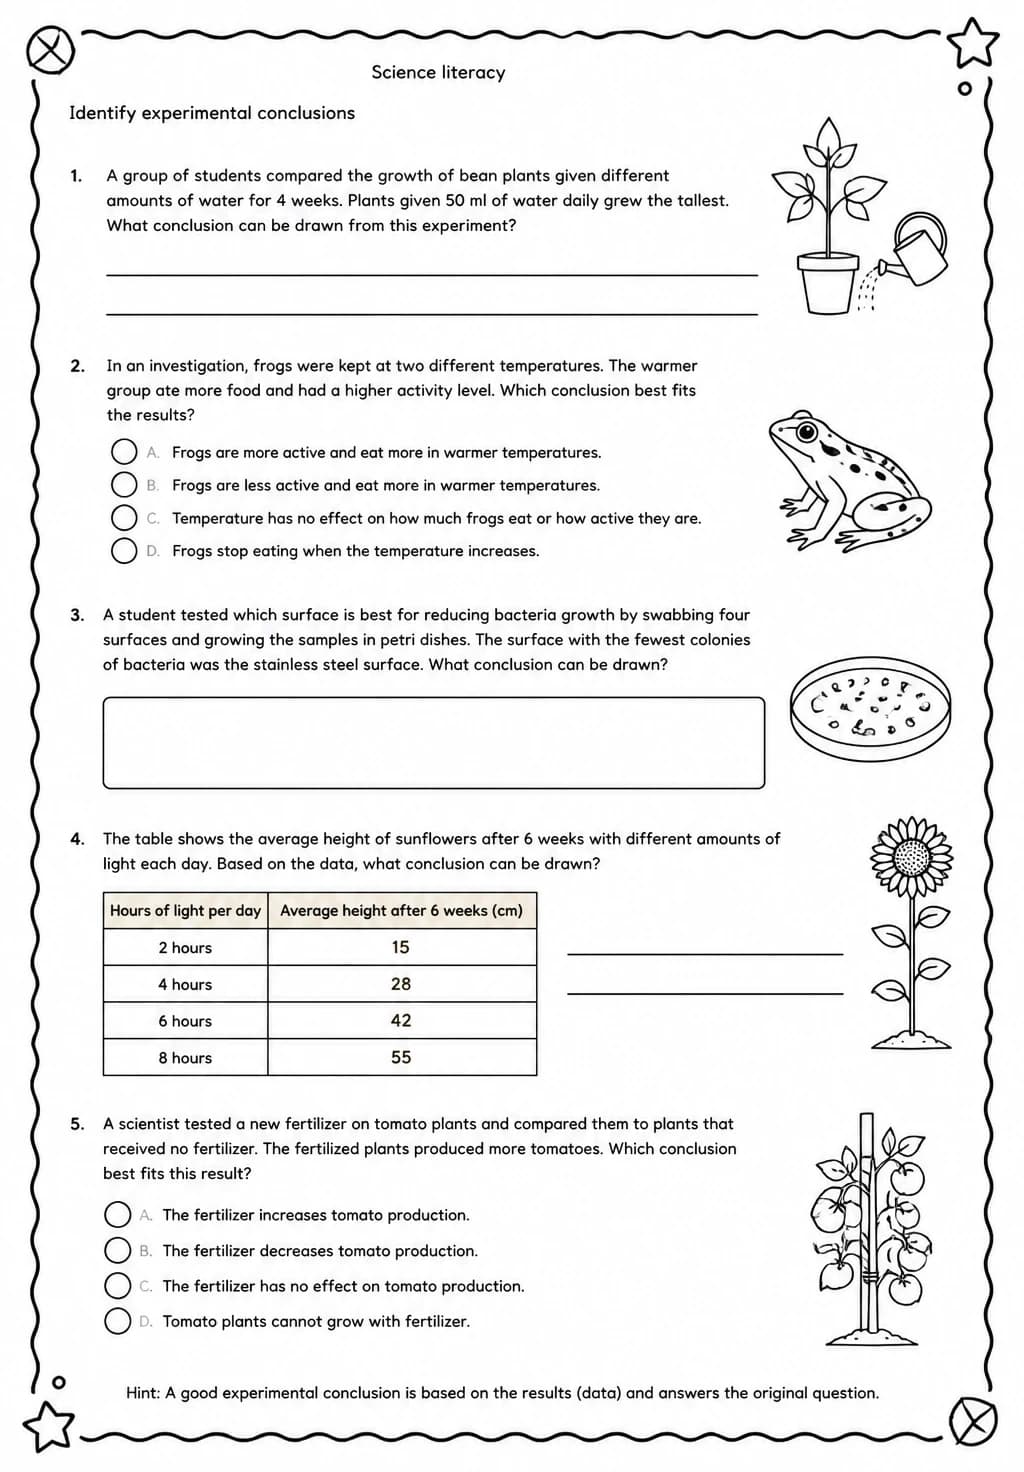
Identify experimental conclusions