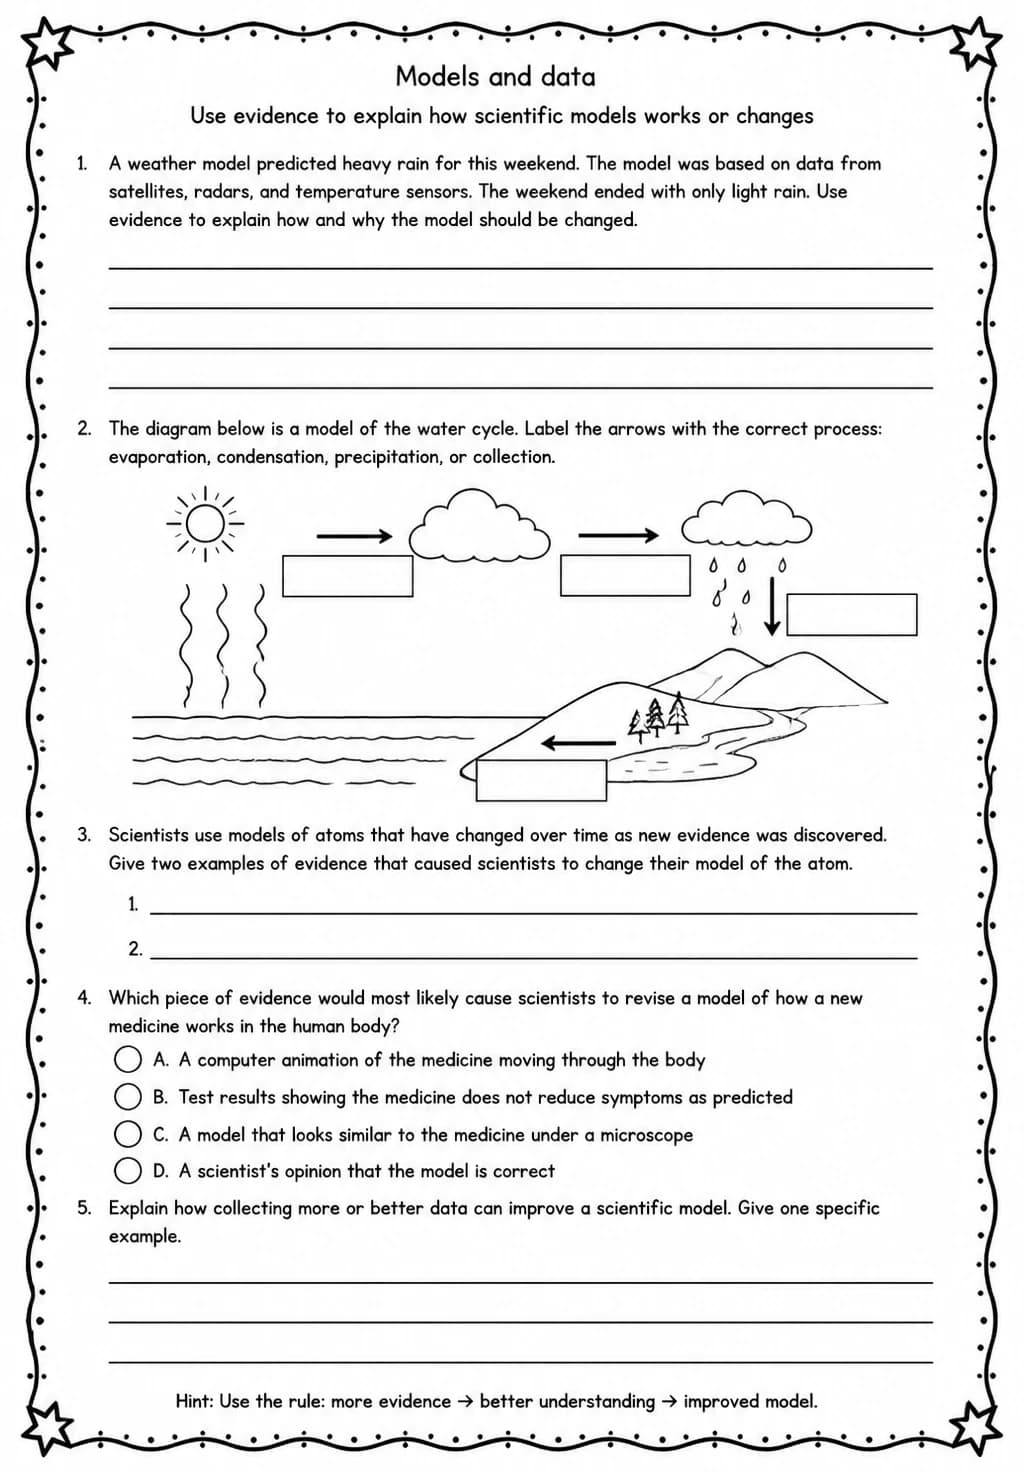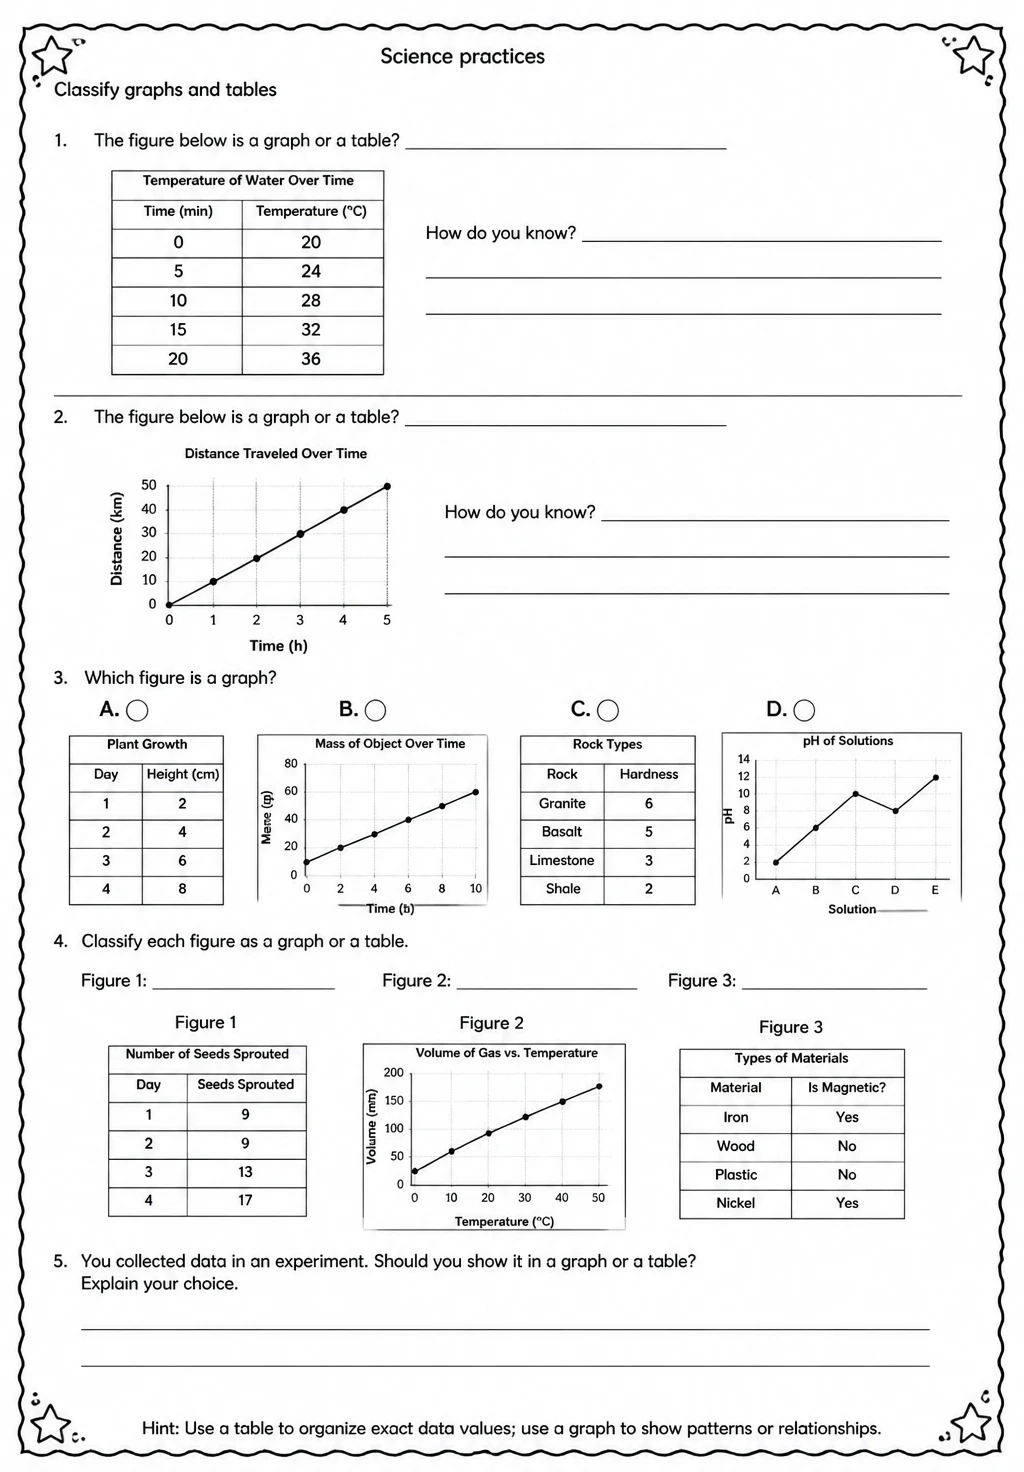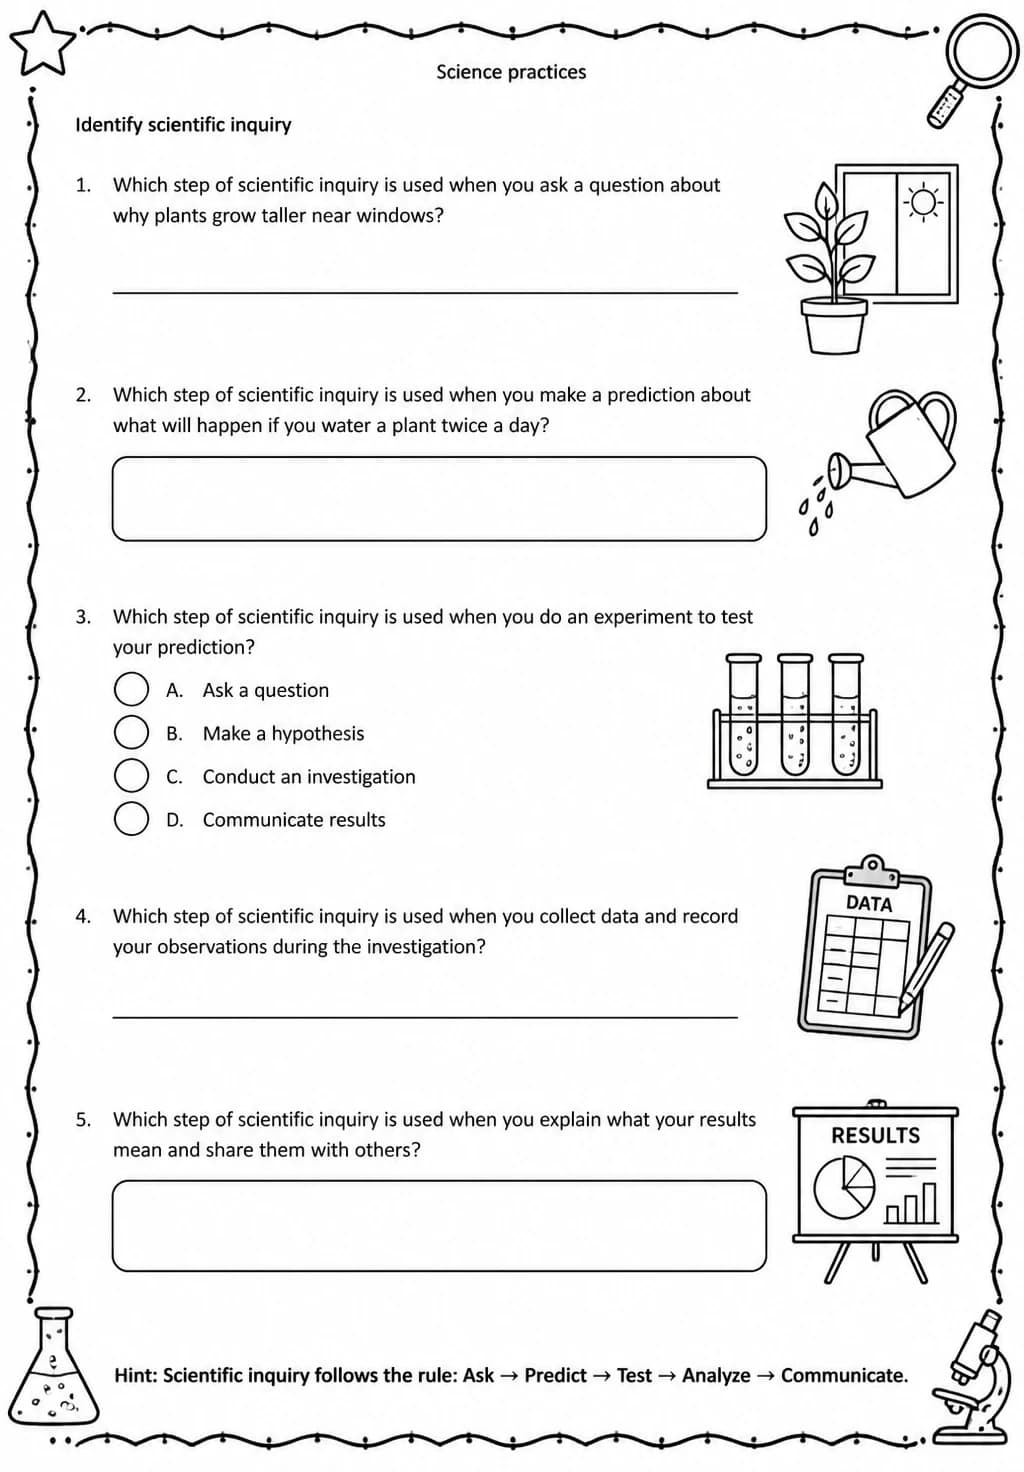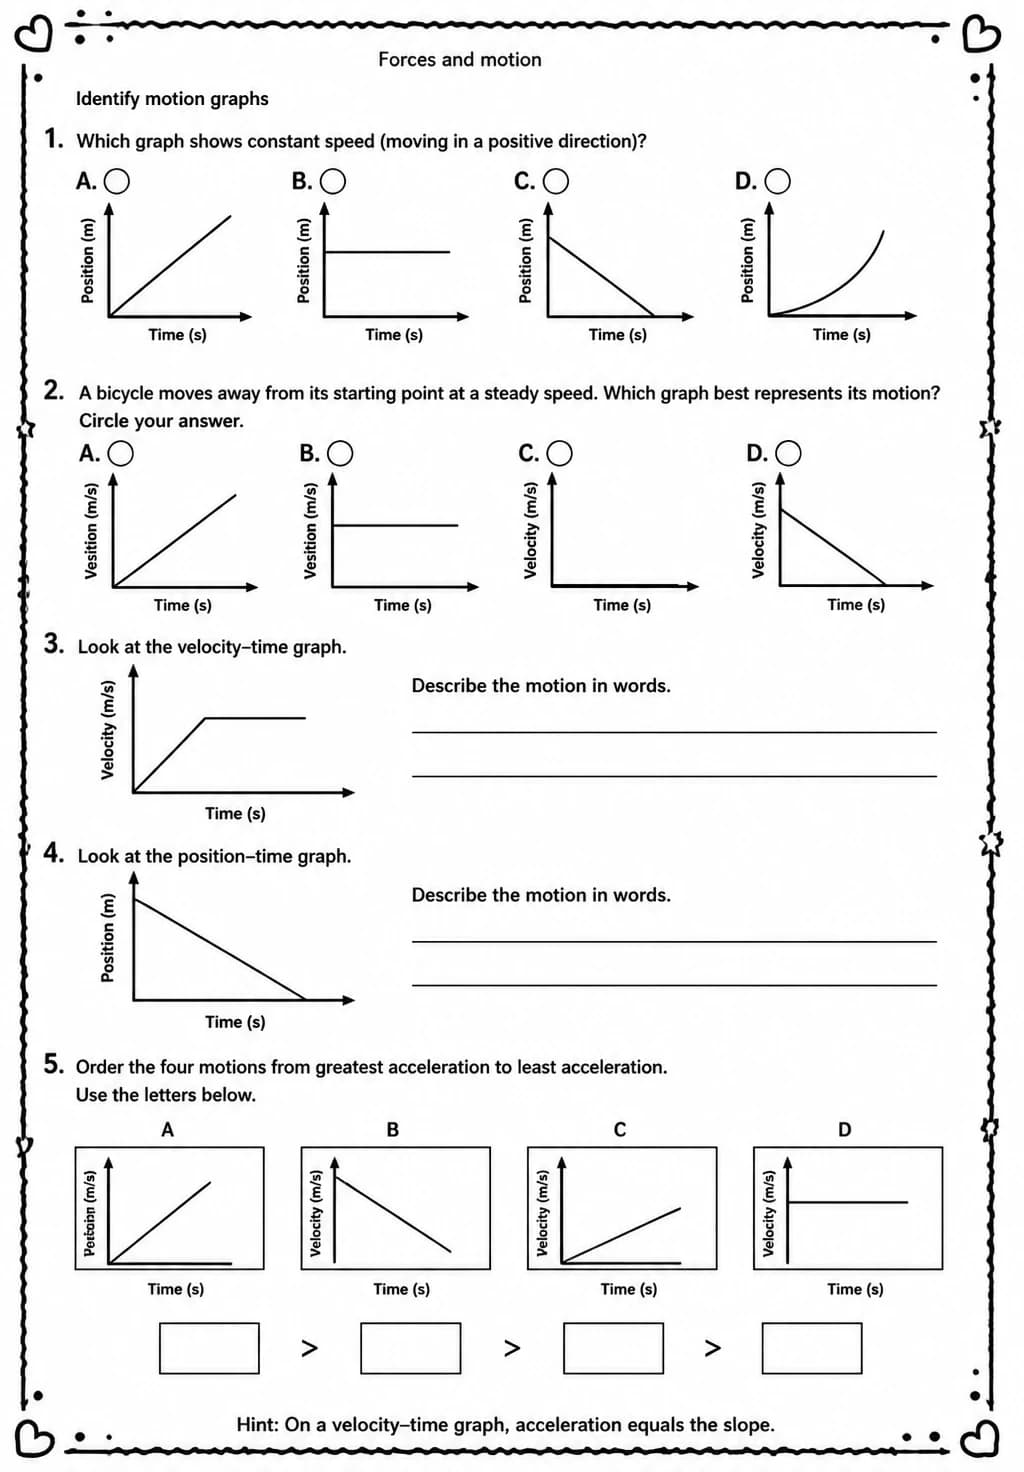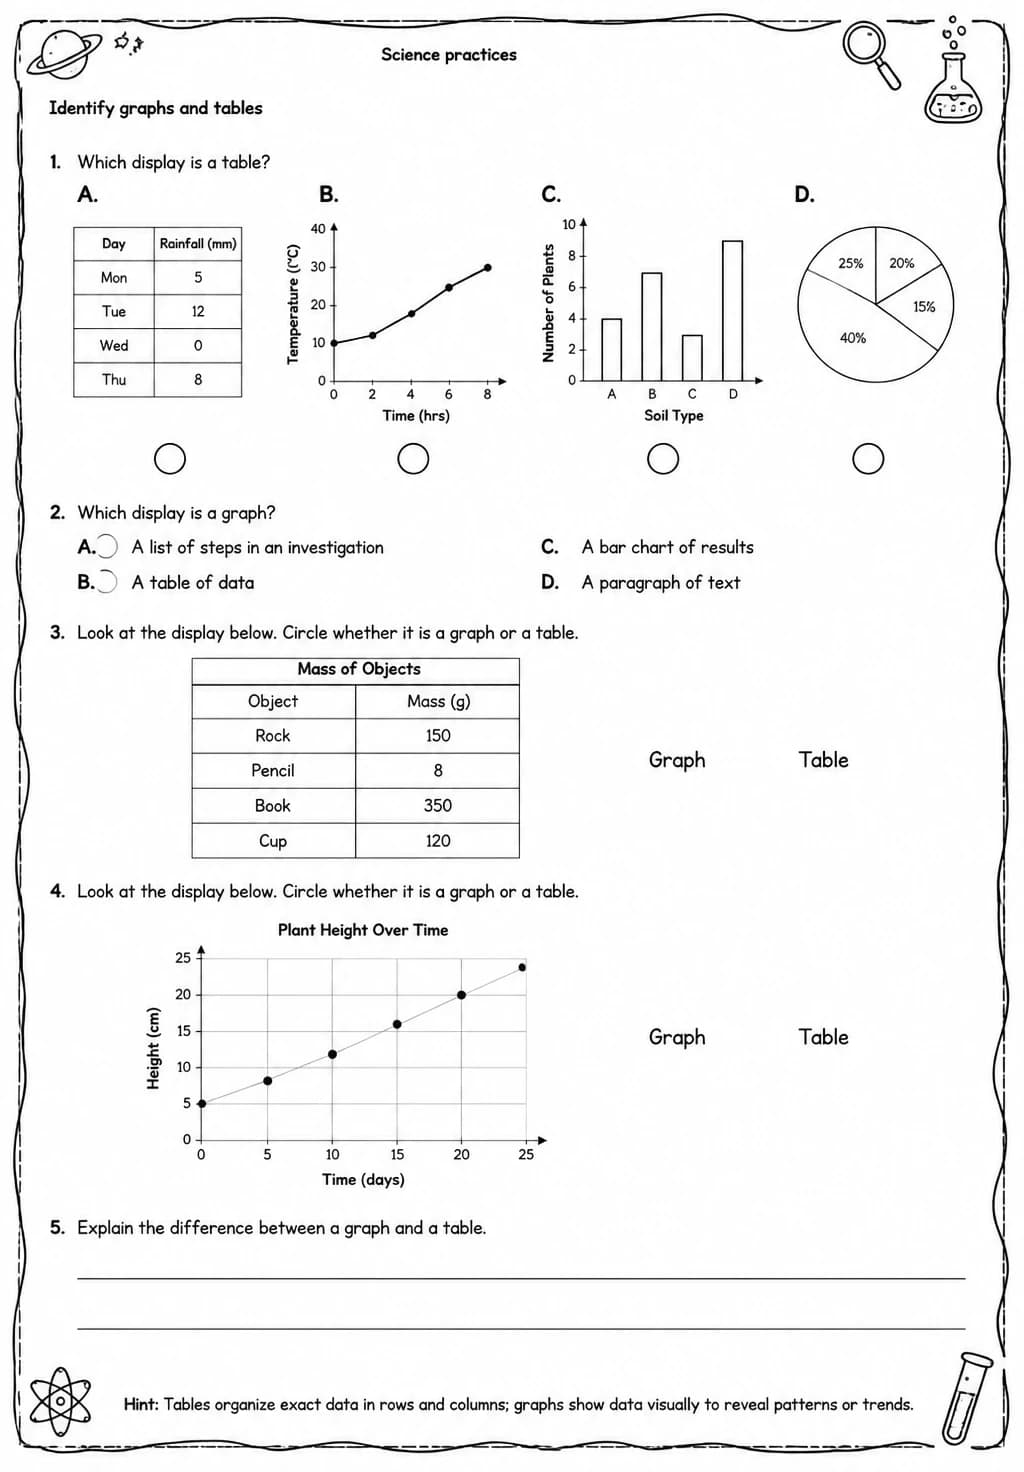
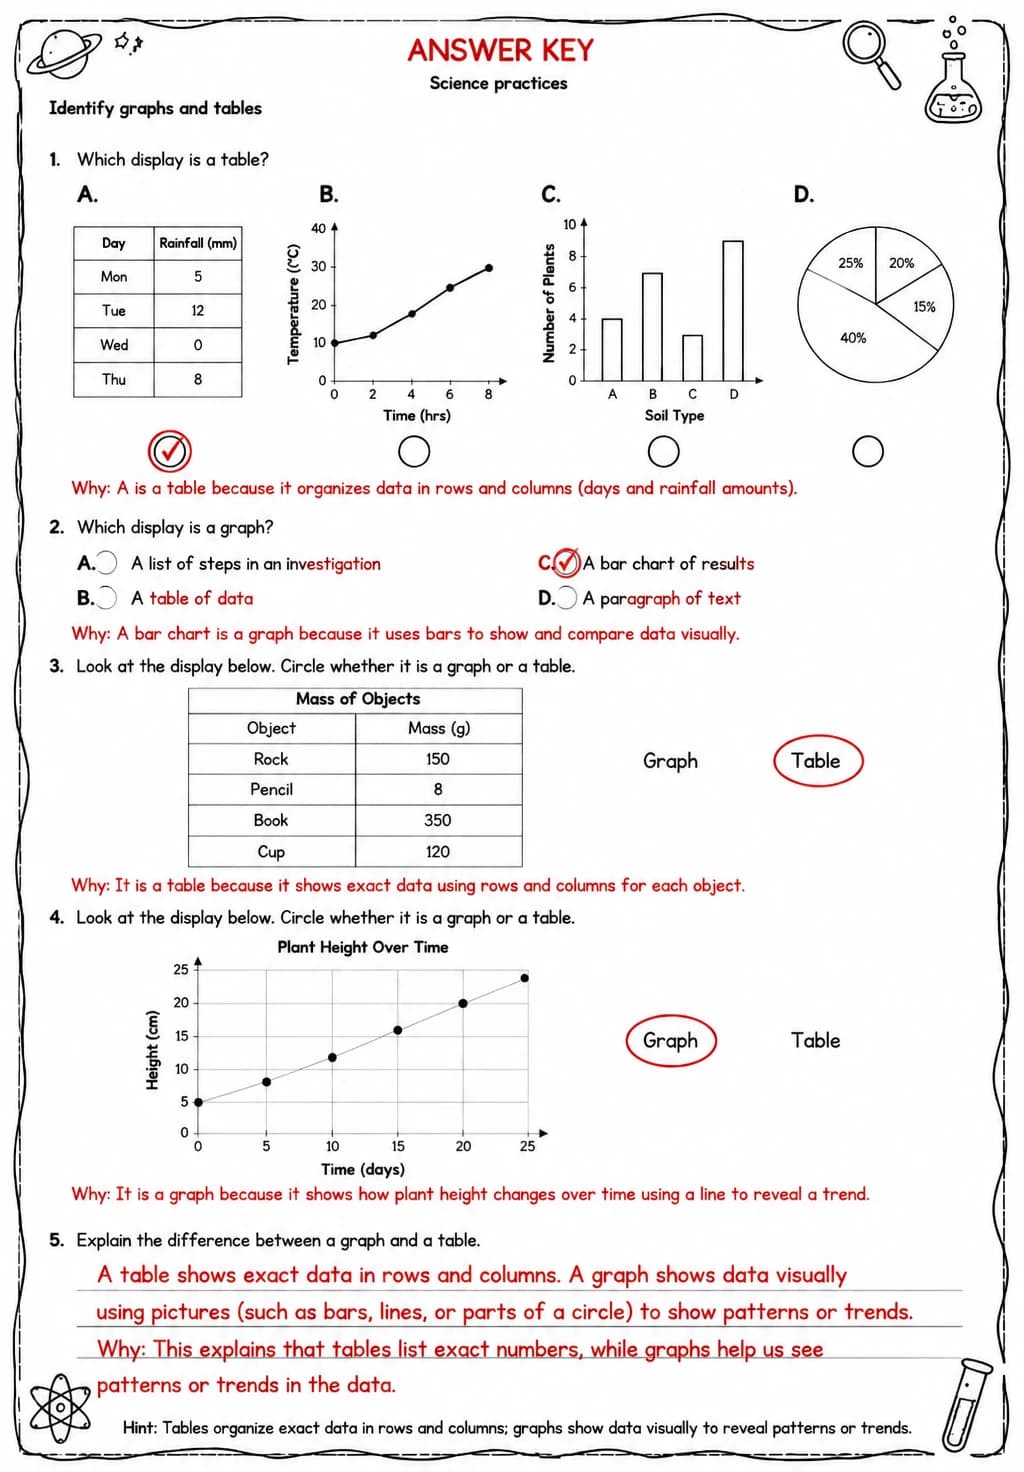
Identify graphs and tables
Free printable Grade 6 science worksheet for "Identify graphs and tables" — practice science practices. No-prep, print or assign online.
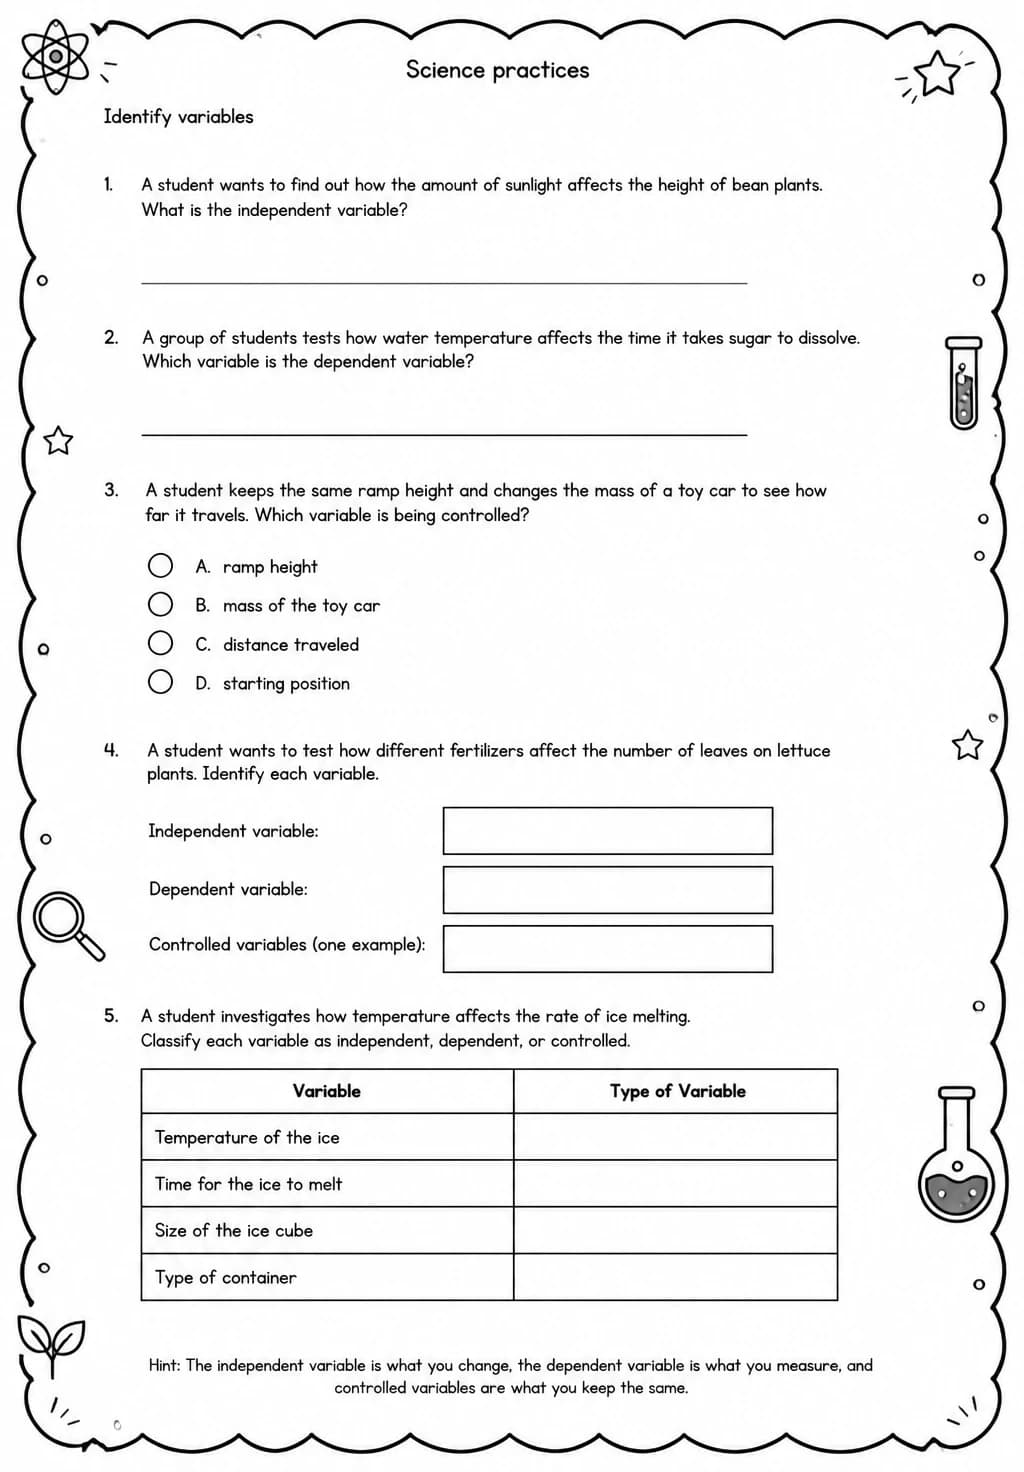
Grades 6–8 students practice identifying and interpreting graphs and tables as data representation tools in this challenging Science Practices worksheet. Teachers can use it to build students' data-literacy skills, helping them move between visual and tabular formats to extract and communicate scientific information. Reading graphs and tables accurately is a core scientific and engineering practice that cuts across all science disciplines.
Learning objectives
- Identify key features of scientific graphs and data tables, including axes, labels, and scales
- Extract and interpret data from graphs and tables to answer questions
- Select the appropriate graph or table format to represent a given set of scientific data
Answer Key
How to use this worksheet
- Click “Download Worksheet” and sign in with Google or email to get the PDF instantly.
- Print at home or in class for Middle School; it's no-prep, with no extra materials needed.
- Use the included answer key to mark it in seconds.
Frequently asked questions
Is the “Identify graphs and tables” worksheet free?
Yes. “Identify graphs and tables” is a free printable Science worksheet. Sign in with Google or email to download the PDF instantly.
What grade or age is this Science worksheet for?
It's designed for Middle School (ages 11–14), covering Science practices.
Does it come with an answer key?
Yes — a matching answer key is included so you can grade it in seconds.
Create more worksheets in our Worksheet Studio
Generate fresh worksheets for any grade, topic, and language — free.
Open the Worksheet StudioMore for Middle School

Complementary and supplementary angles

Solve one-step multiplication and division equations with decimals and fractions
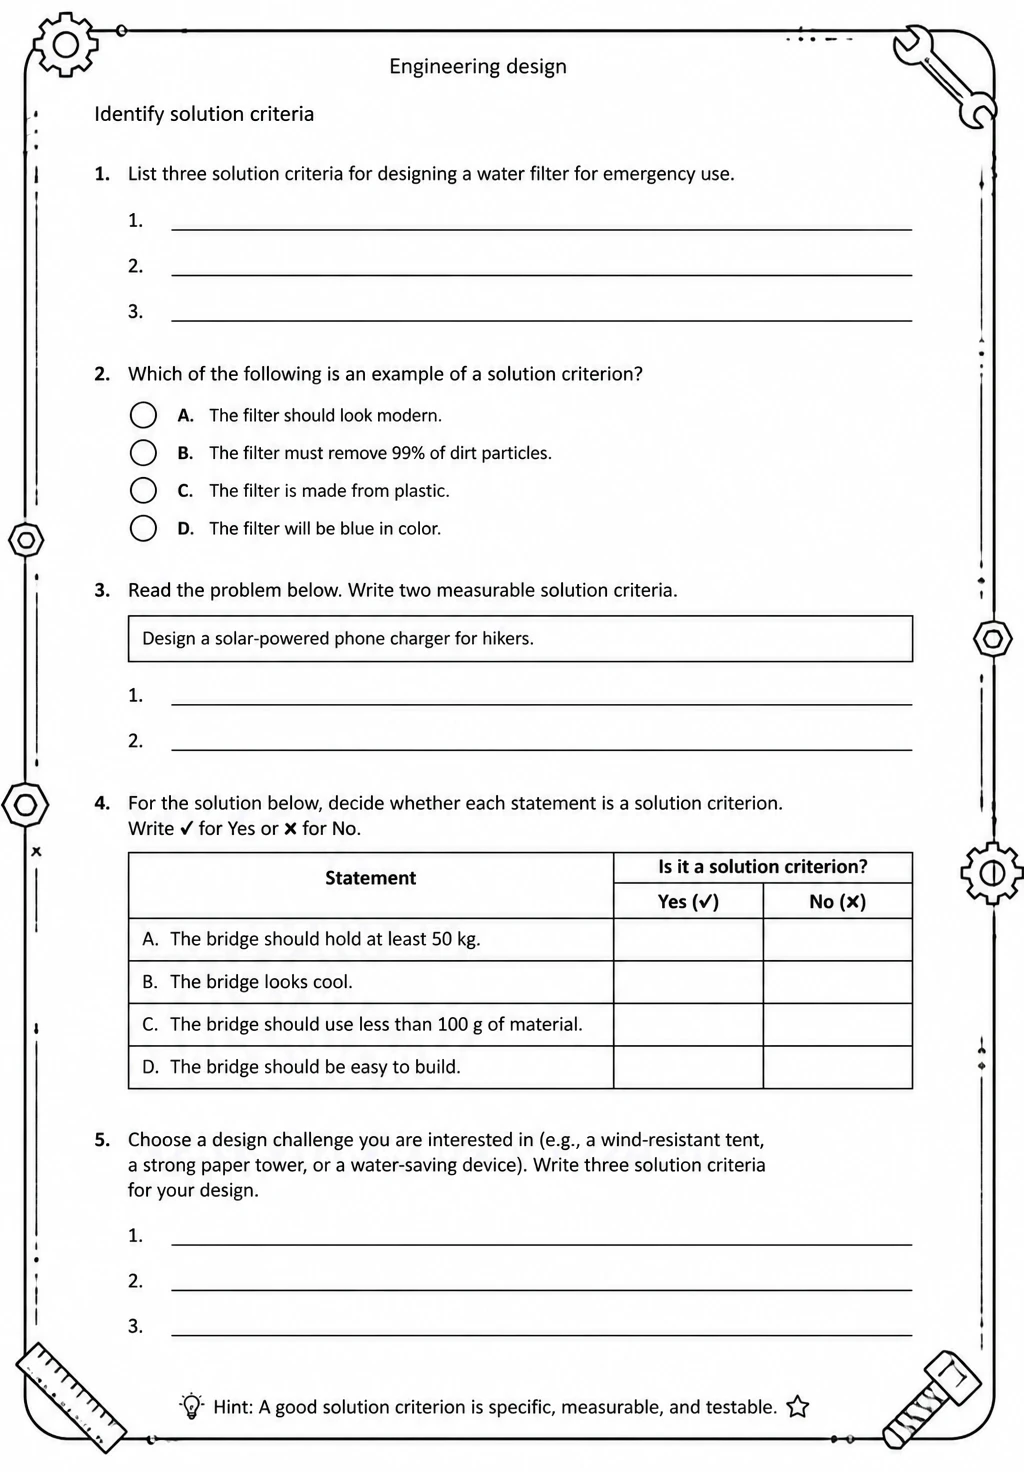
Identify solution criteria