Identify graphing data
Free printable Physics science worksheet for "Identify graphing data" — practice science foundations. No-prep, print or assign online.
High school students practice identifying how to represent and organize data in graphs appropriate for the type of information being displayed in this Science Foundations worksheet. Teachers can use it to build data-literacy skills and ensure students can select the right graph type — bar, line, scatter, or pie — for a given dataset before conducting investigations. It belongs in a Scientific and Engineering Practices unit and supports quantitative reasoning across all high school science disciplines.
Learning objectives
- Identify the appropriate type of graph for representing specific scientific datasets
- Explain what each graph type reveals about patterns, trends, or relationships in data
- Evaluate whether a given graph accurately and clearly communicates its data
Answer Key

How to use this worksheet
- Click “Download Worksheet” and sign in with Google or email to get the PDF instantly.
- Print at home or in class for High School; it's no-prep, with no extra materials needed.
- Use the included answer key to mark it in seconds.
Frequently asked questions
Is the “Identify graphing data” worksheet free?
Yes. “Identify graphing data” is a free printable Science worksheet. Sign in with Google or email to download the PDF instantly.
What grade or age is this Science worksheet for?
It's designed for High School (ages 14–18), covering Science foundations.
Does it come with an answer key?
Yes — a matching answer key is included so you can grade it in seconds.
Create more worksheets in our Worksheet Studio
Generate fresh worksheets for any grade, topic, and language — free.
Open the Worksheet StudioMore for High School

You might also like
Identify scientific inquiry
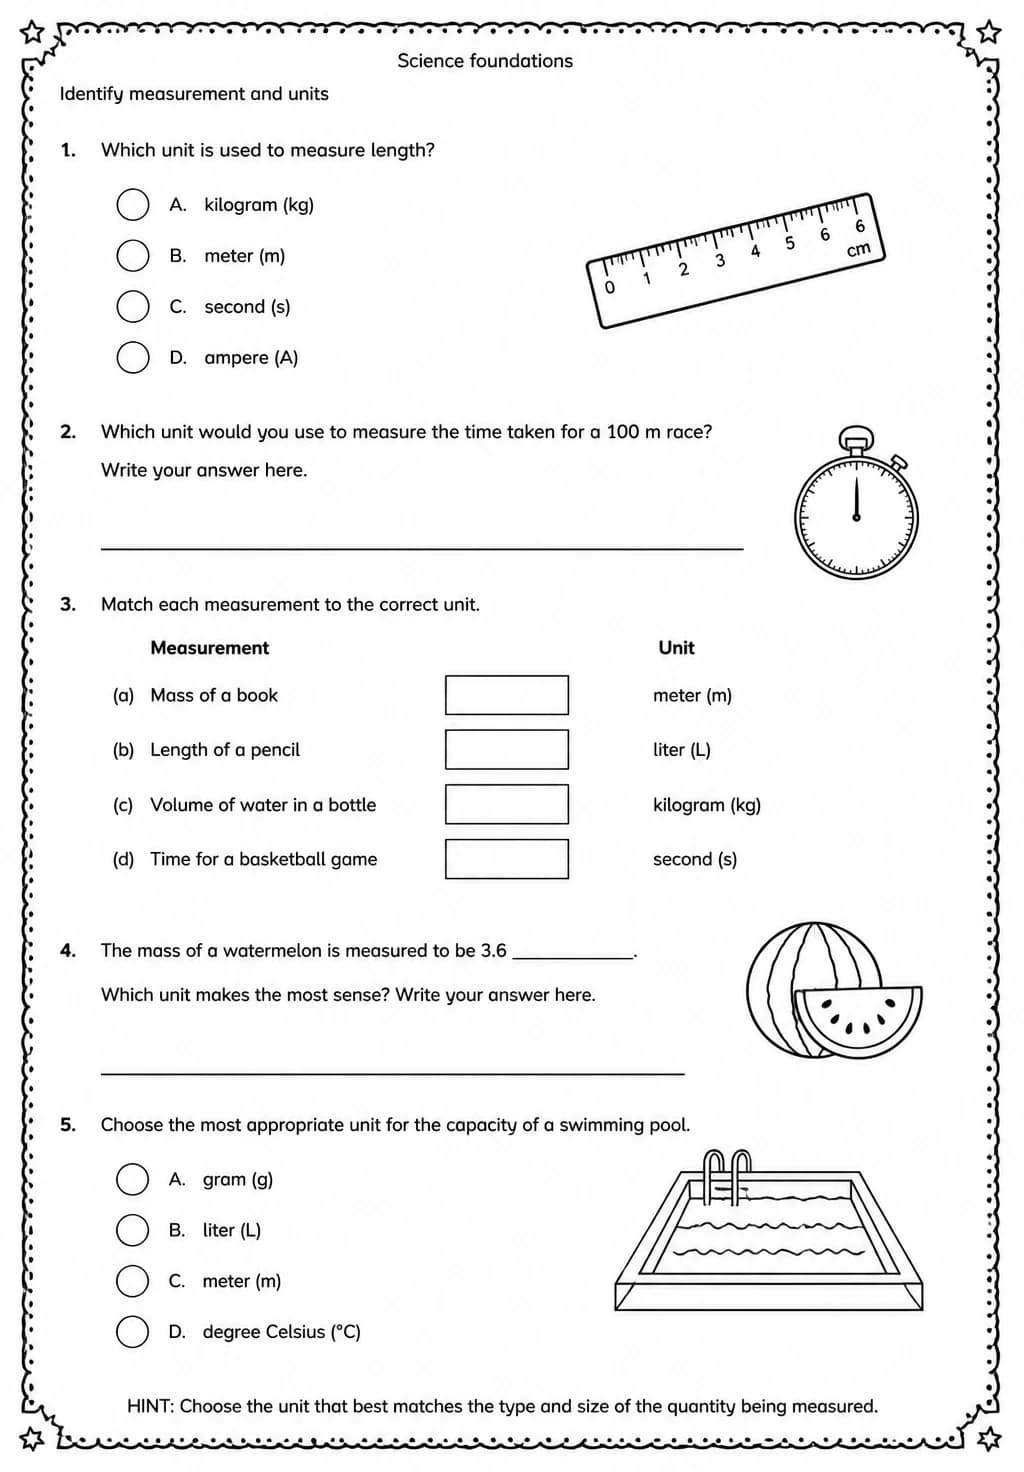
Identify measurement and units
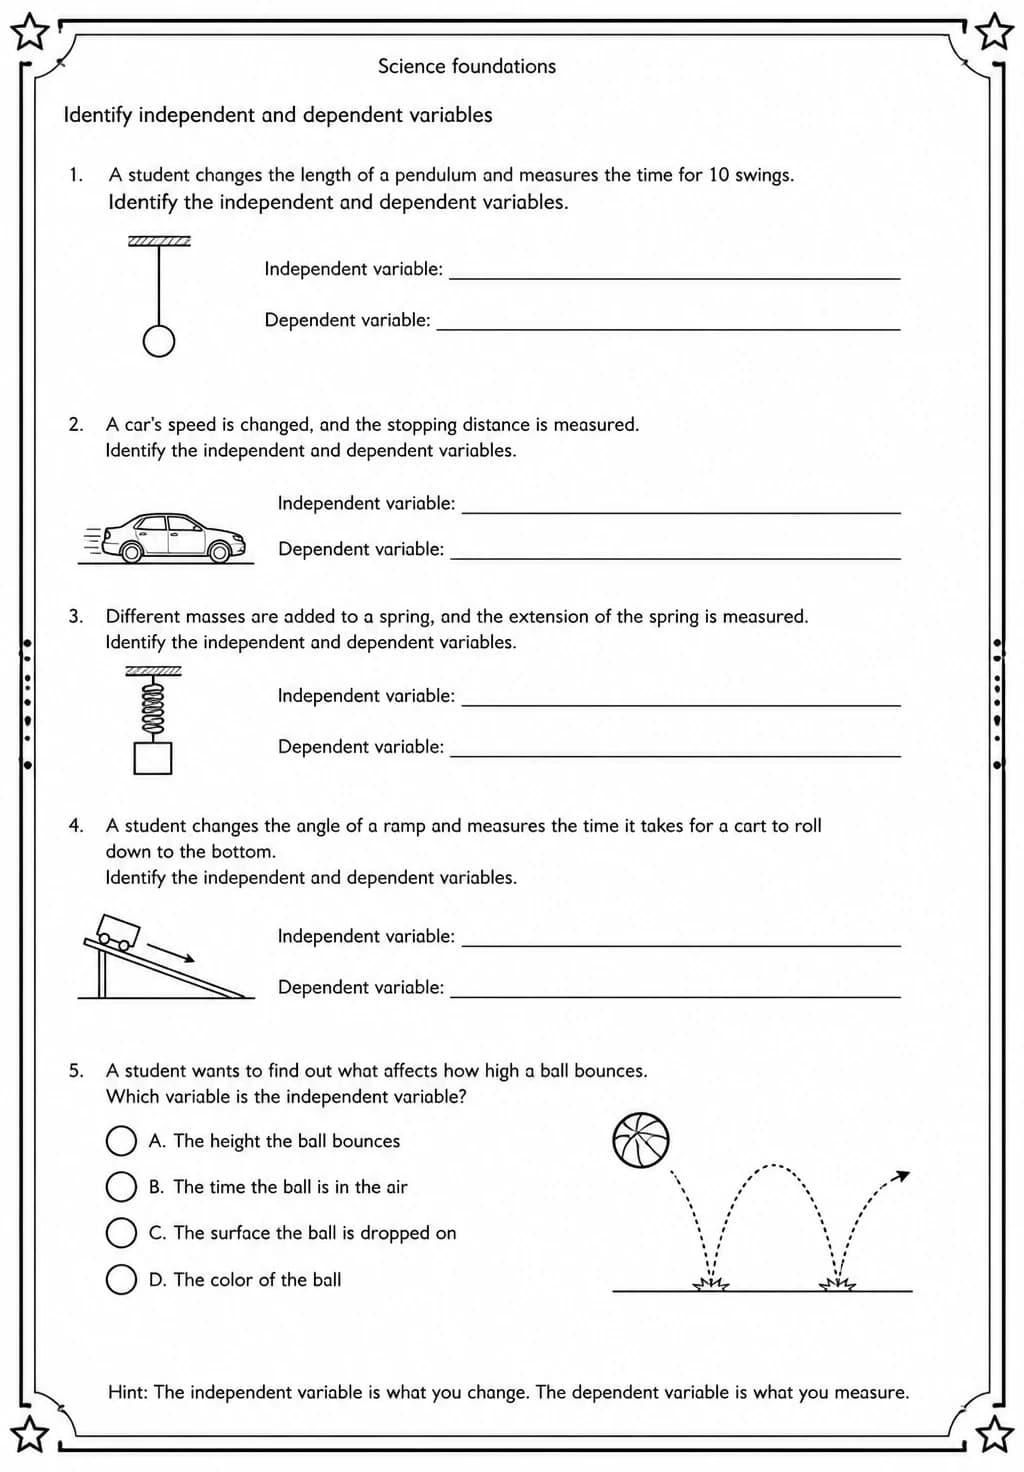
Identify independent and dependent variables
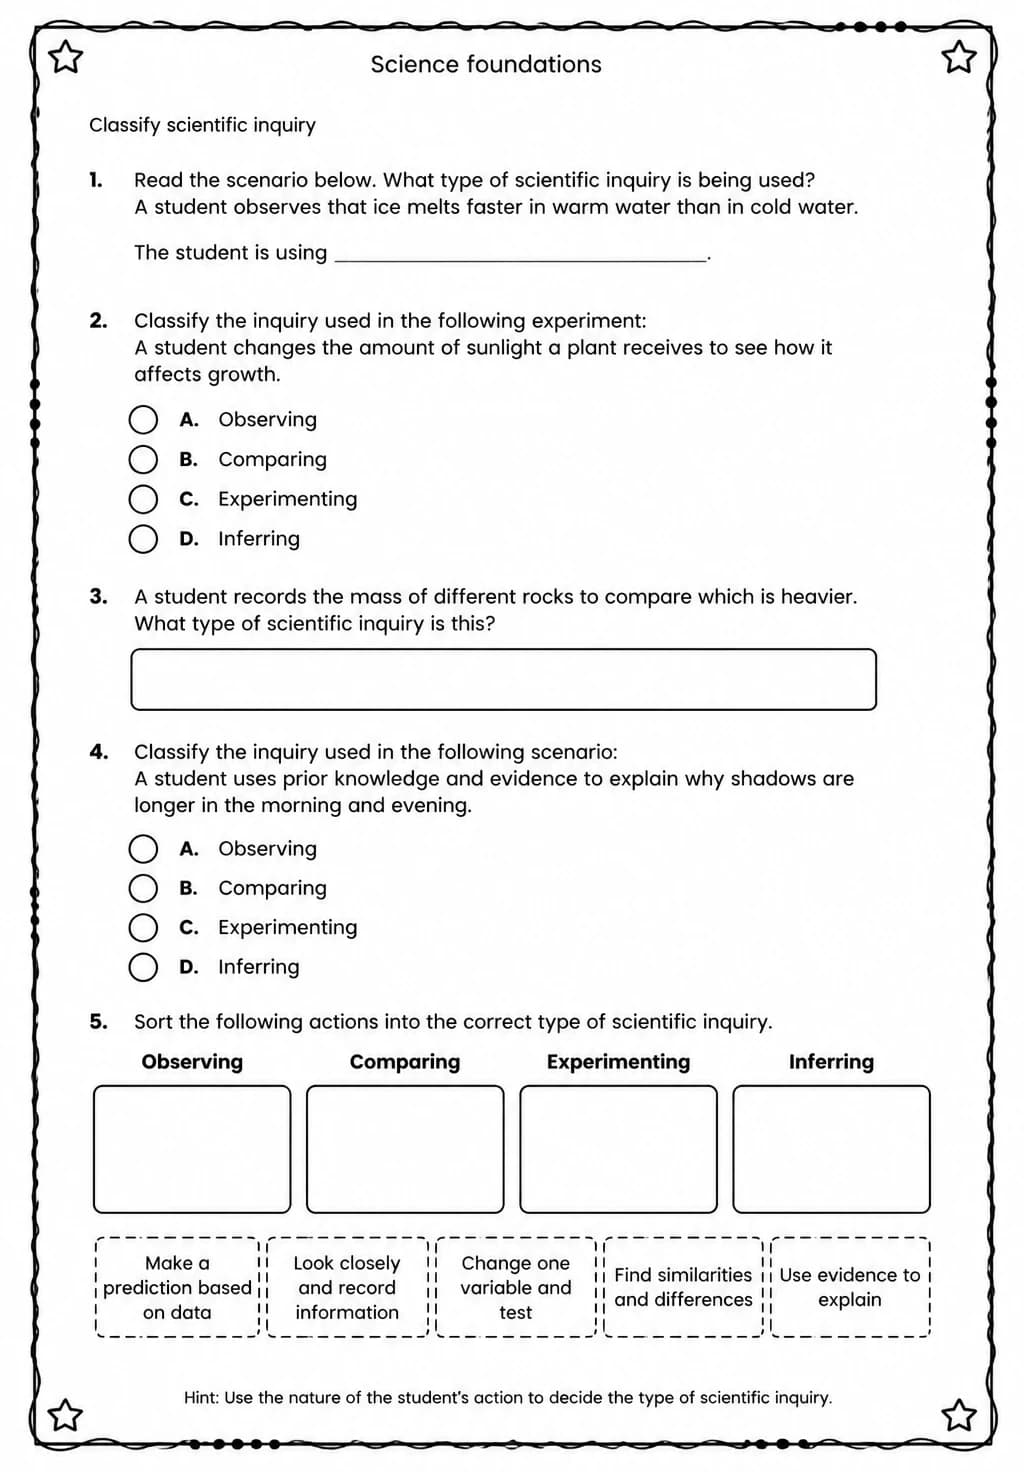
Classify scientific inquiry
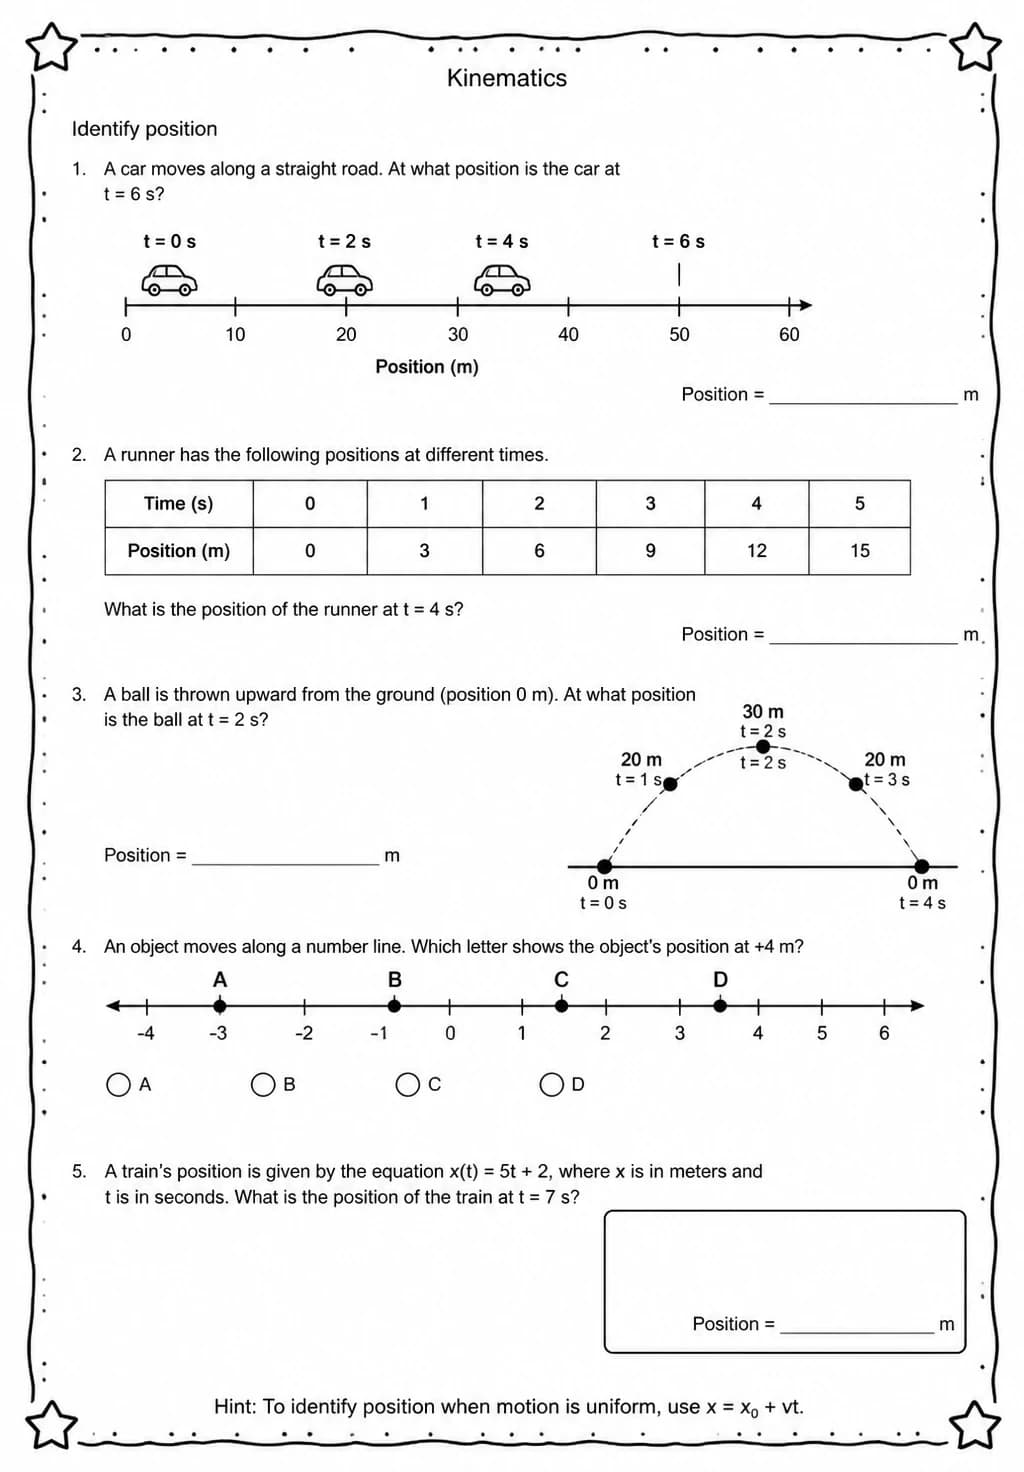
Identify position