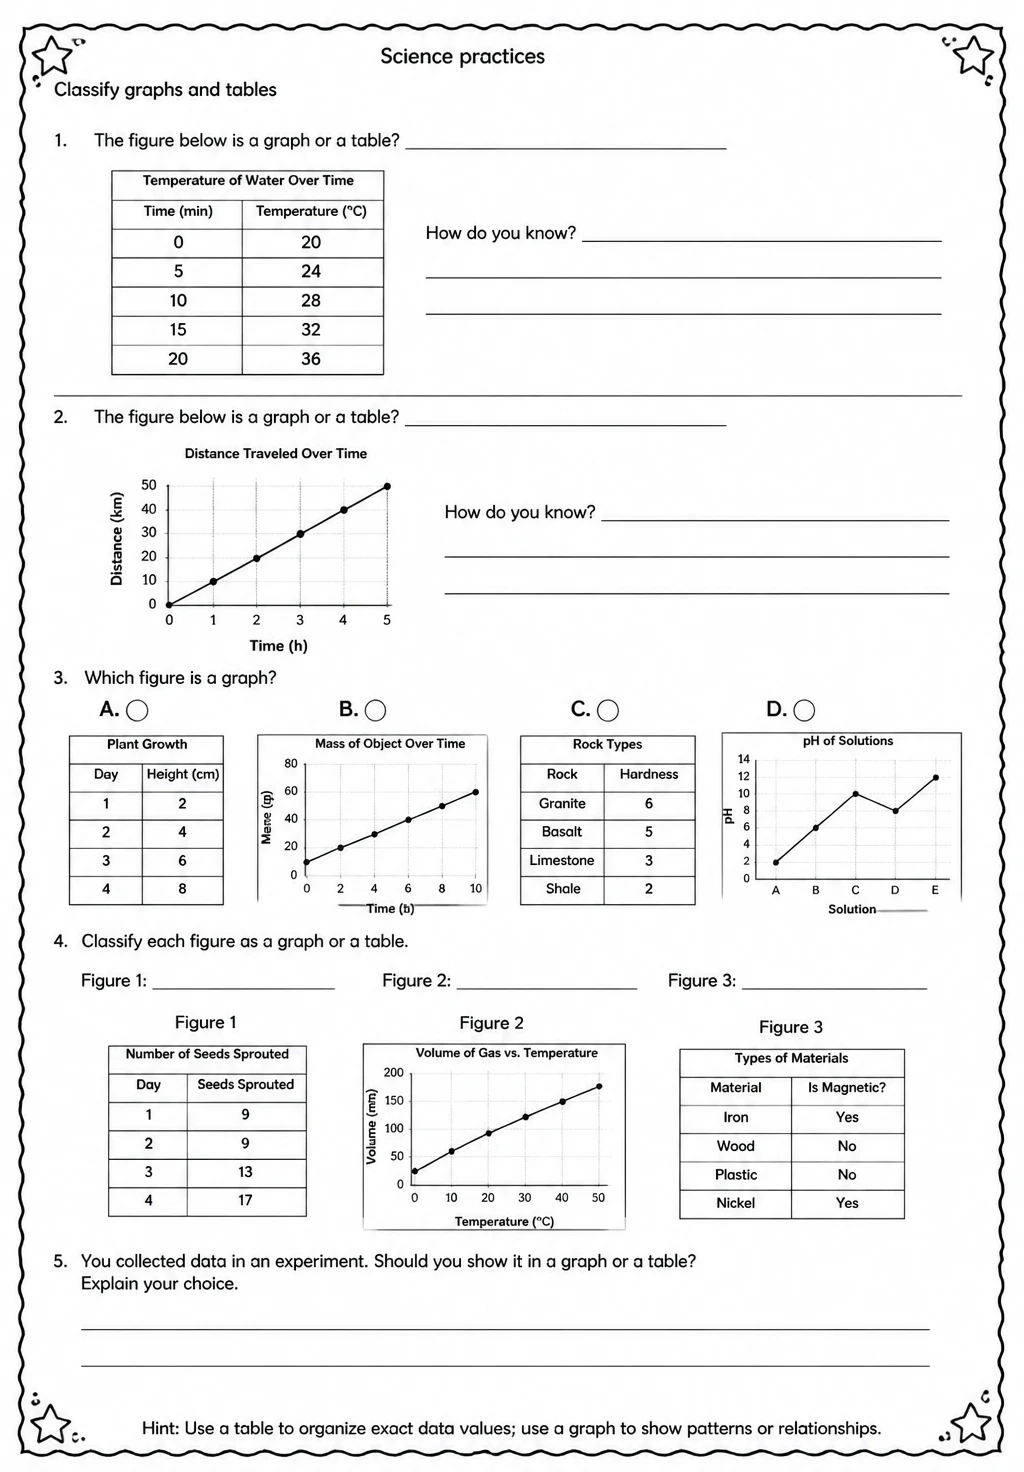
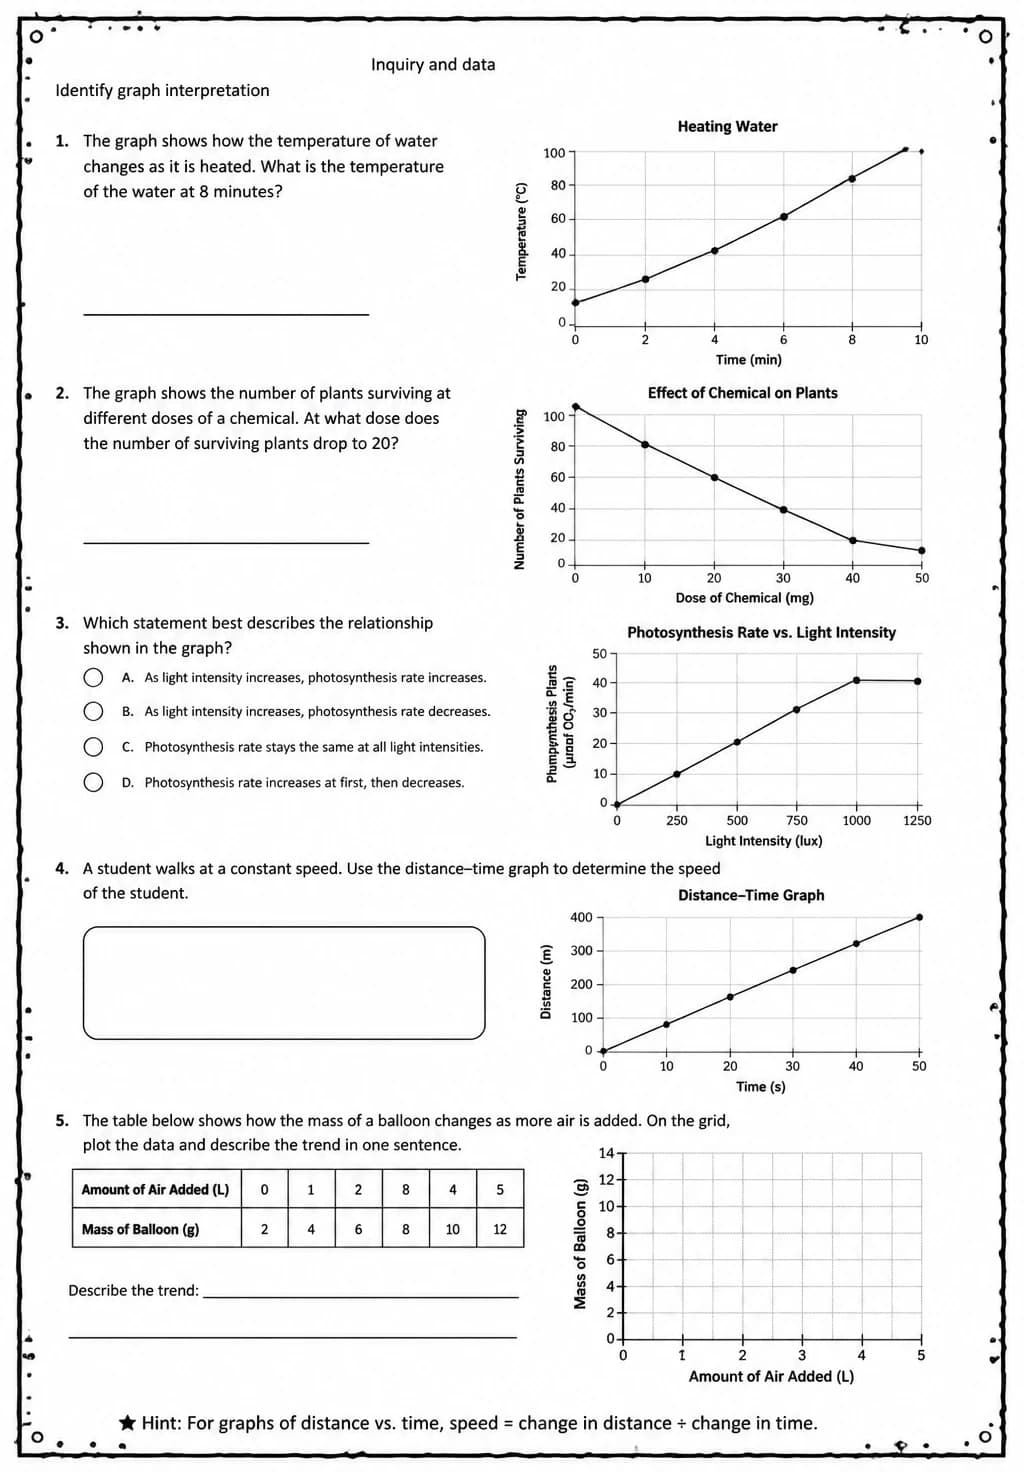
Classify graph interpretation
Free printable Grade 7 science worksheet for "Classify graph interpretation" — practice inquiry and data. No-prep, print or assign online.
This middle-school science worksheet challenges Grade 6–8 students to classify graph interpretation across a variety of data displays, building the analytical skills central to Inquiry and data. Teachers can use it to scaffold evidence-based reasoning before lab reports or data analysis tasks, prompting students to explain what graphs actually show. It fits naturally into units on Scientific and Engineering Practices where reading and critiquing data representations is essential.
Learning objectives
- Classify different types of graphs and identify the information each conveys
- Interpret patterns and trends from scientific data displays
- Justify conclusions drawn from graphical evidence using scientific reasoning
Answer Key

How to use this worksheet
- Click “Download Worksheet” and sign in with Google or email to get the PDF instantly.
- Print at home or in class for Middle School; it's no-prep, with no extra materials needed.
- Use the included answer key to mark it in seconds.
Frequently asked questions
Is the “Classify graph interpretation” worksheet free?
Yes. “Classify graph interpretation” is a free printable Science worksheet. Sign in with Google or email to download the PDF instantly.
What grade or age is this Science worksheet for?
It's designed for Middle School (ages 11–14), covering Inquiry and data.
Does it come with an answer key?
Yes — a matching answer key is included so you can grade it in seconds.
Create more worksheets in our Worksheet Studio
Generate fresh worksheets for any grade, topic, and language — free.
Open the Worksheet StudioMore for Middle School

Complementary and supplementary angles

Solve one-step multiplication and division equations with decimals and fractions
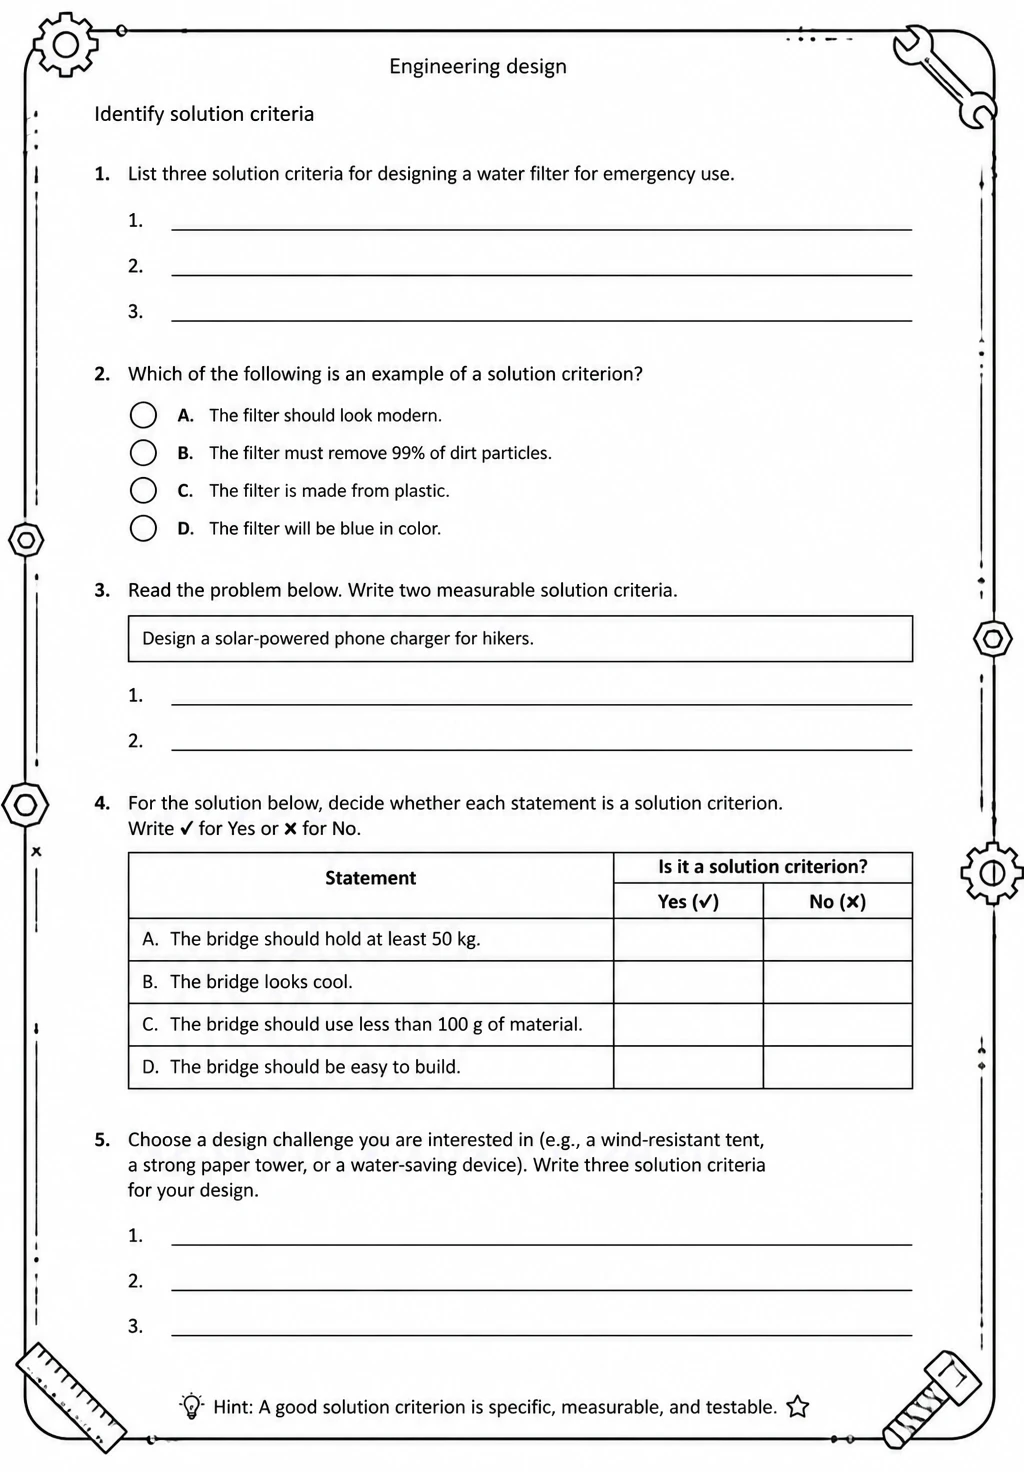
Identify solution criteria
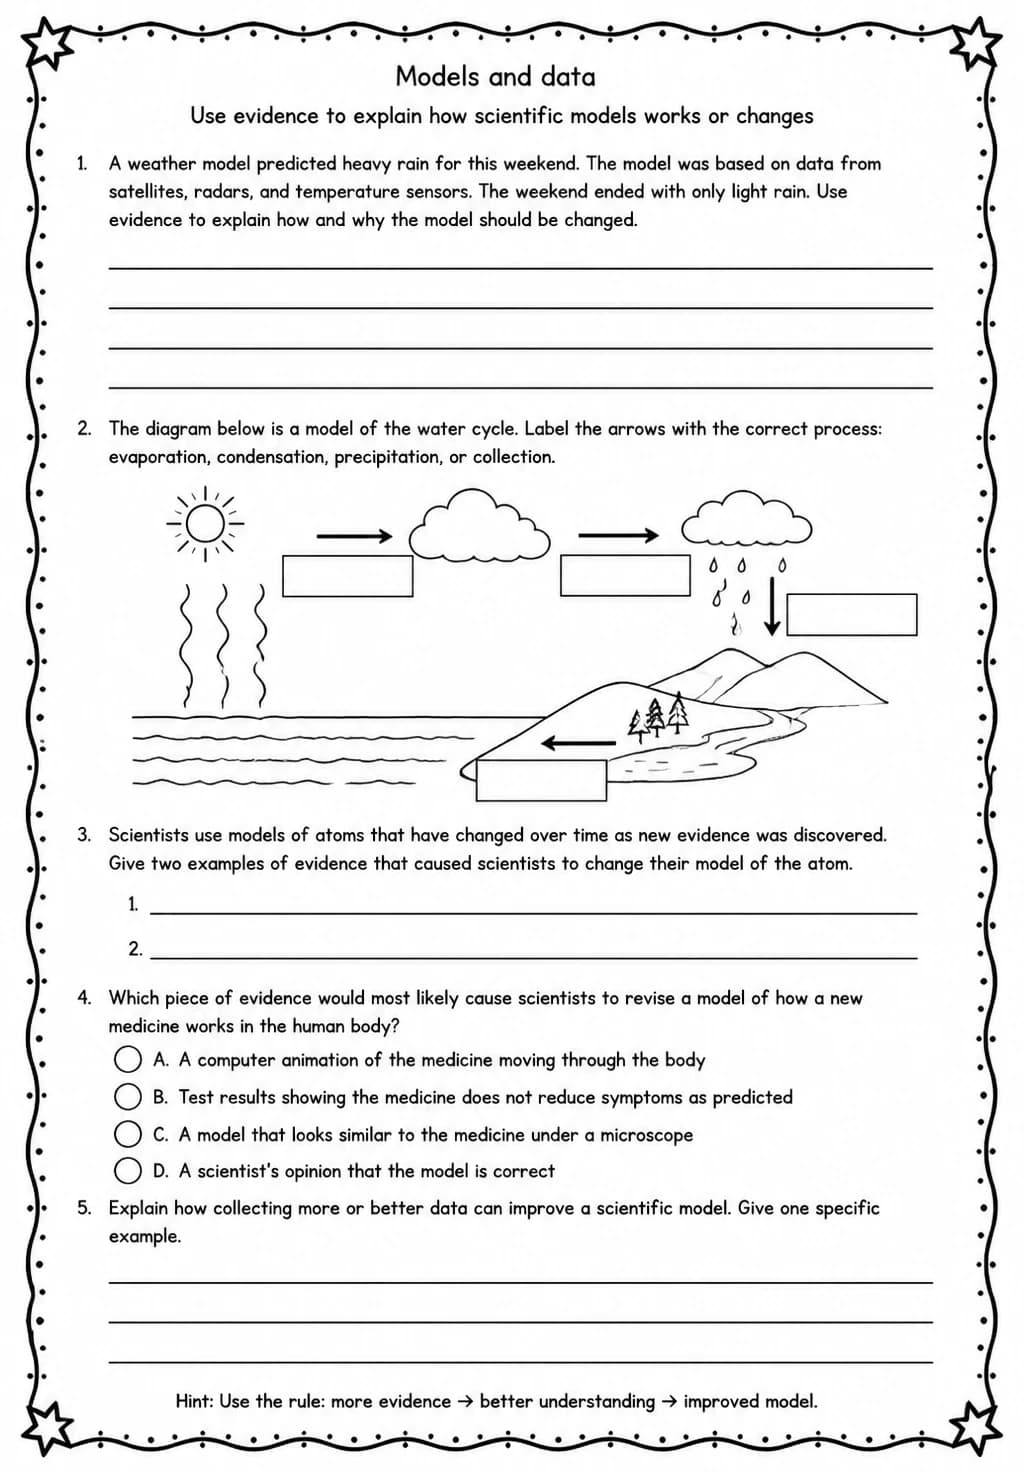
Use evidence to explain how scientific models works or changes
You might also like
Identify graph interpretation

Classify data analysis
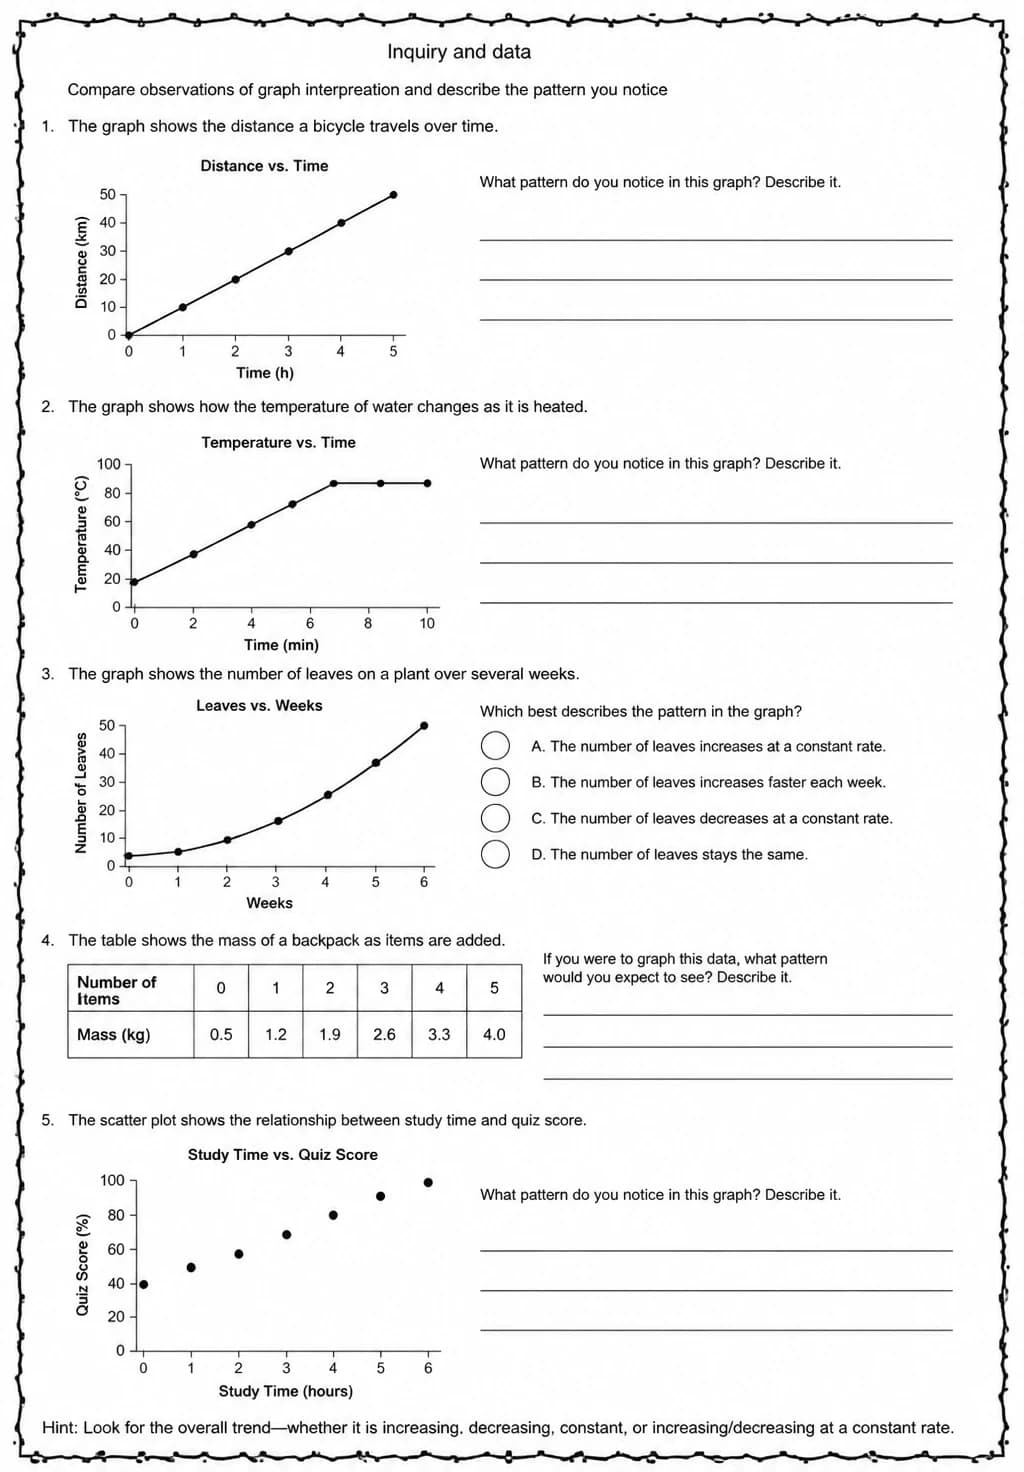
Compare observations of graph interpretation and describe the pattern you notice
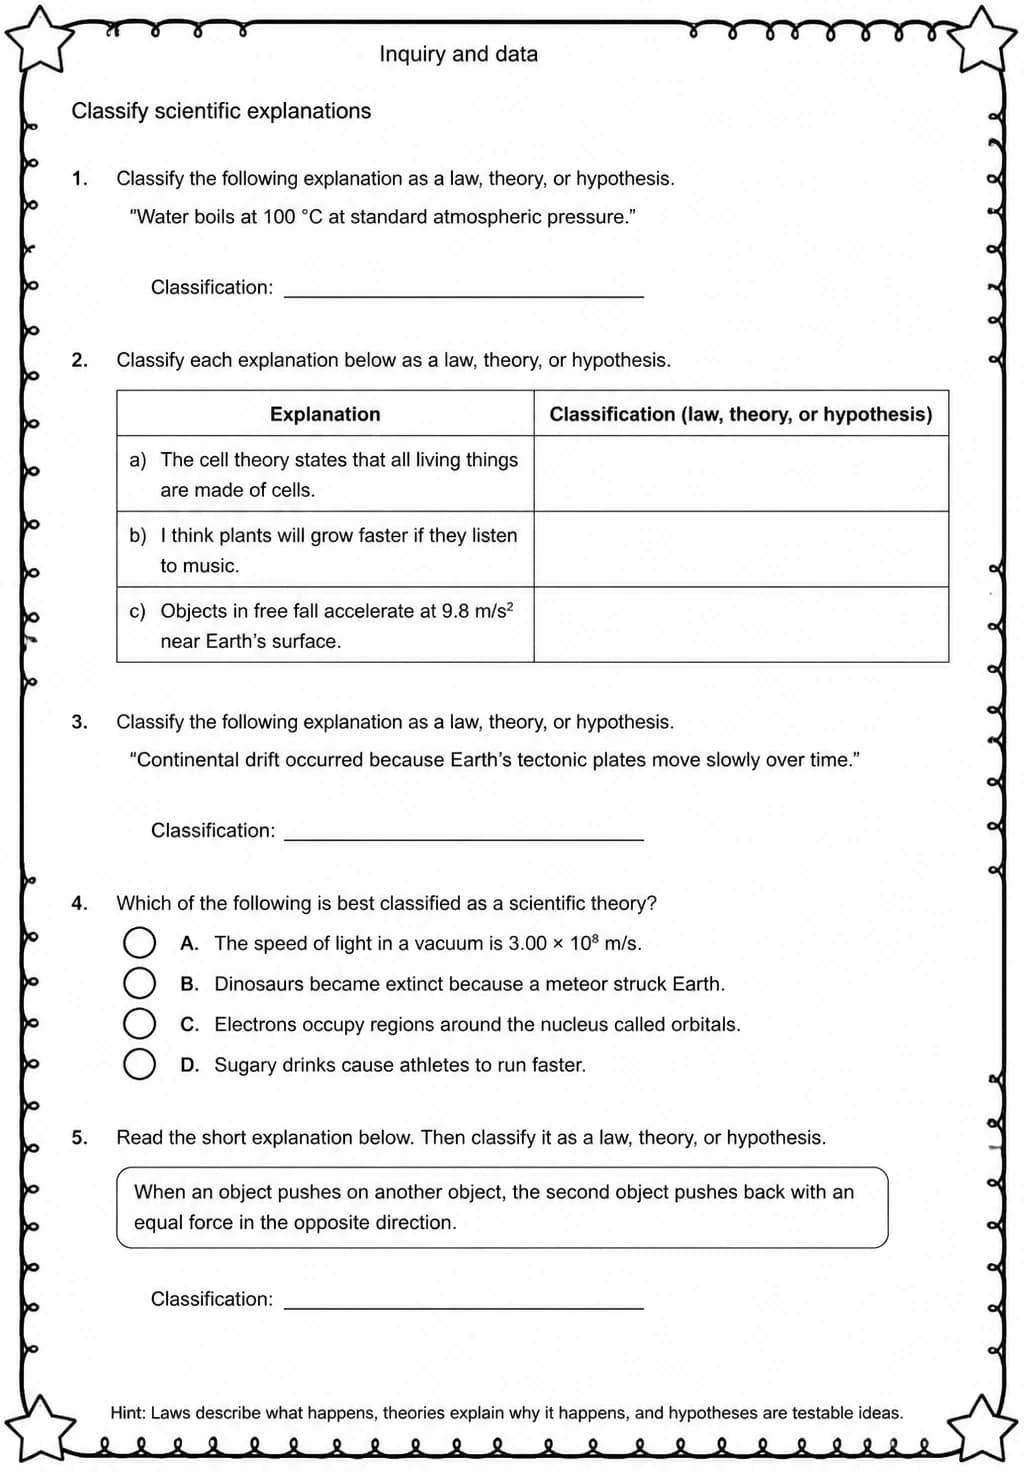
Classify scientific explanations
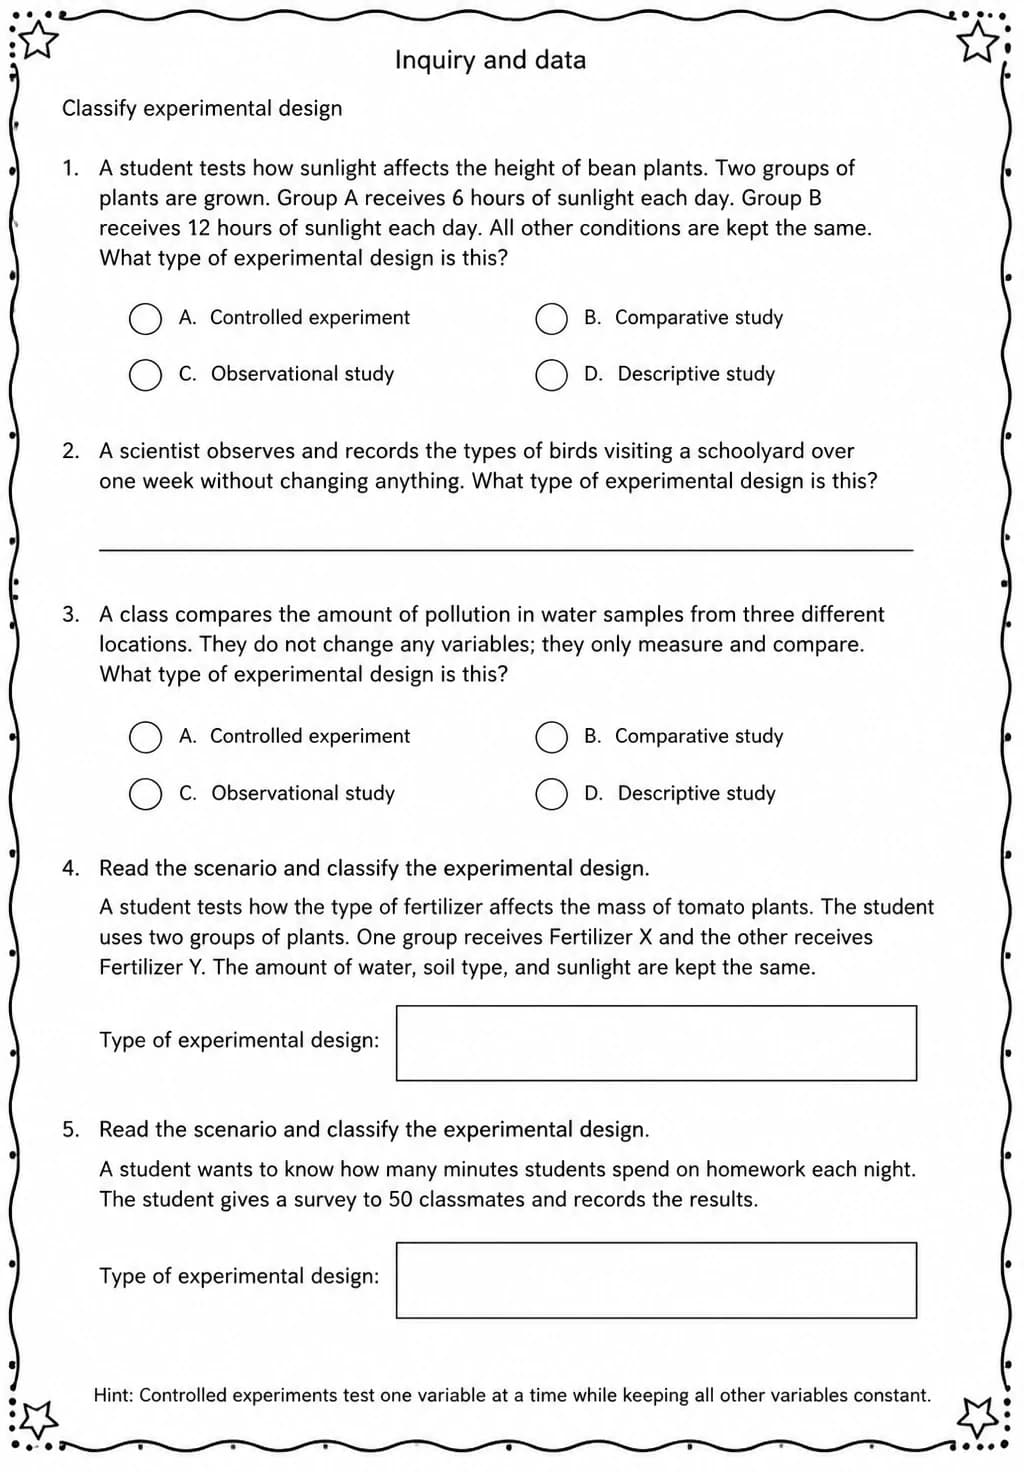
Classify experimental design