
Interpret bar graphs
Free printable Grade 6 math worksheet for "Interpret bar graphs" — practice data and graphs. No-prep, print or assign online.
This worksheet challenges middle school students to interpret complex bar graphs, enhancing their data analysis skills. Teachers can use it to reinforce understanding of data representation and improve students' ability to read and compare graphical information. Ideal for Grade 6 math lessons focused on data and graphs, it supports developing critical thinking and quantitative reasoning.
Learning objectives
- Analyze bar graphs to extract relevant data points accurately
- Compare and contrast information presented in multiple bar graphs
- Draw conclusions and make inferences based on bar graph data
How to use this worksheet
- Click “Download Worksheet” and sign in with Google or email to get the PDF instantly.
- Print at home or in class for Middle School; it's no-prep, with no extra materials needed.
- Hand it out as classwork, homework, or a quick warm-up.
Frequently asked questions
Is the “Interpret bar graphs” worksheet free?
Yes. “Interpret bar graphs” is a free printable Math worksheet. Sign in with Google or email to download the PDF instantly.
What grade or age is this Math worksheet for?
It's designed for Middle School (ages 11–14), covering Data and graphs.
Do I need to prep anything?
No. It's a no-prep, print-and-go worksheet — just download and hand it out.
Create more worksheets in our Worksheet Studio
Generate fresh worksheets for any grade, topic, and language — free.
Open the Worksheet StudioMore for Middle School

Complementary and supplementary angles

Solve one-step multiplication and division equations with decimals and fractions
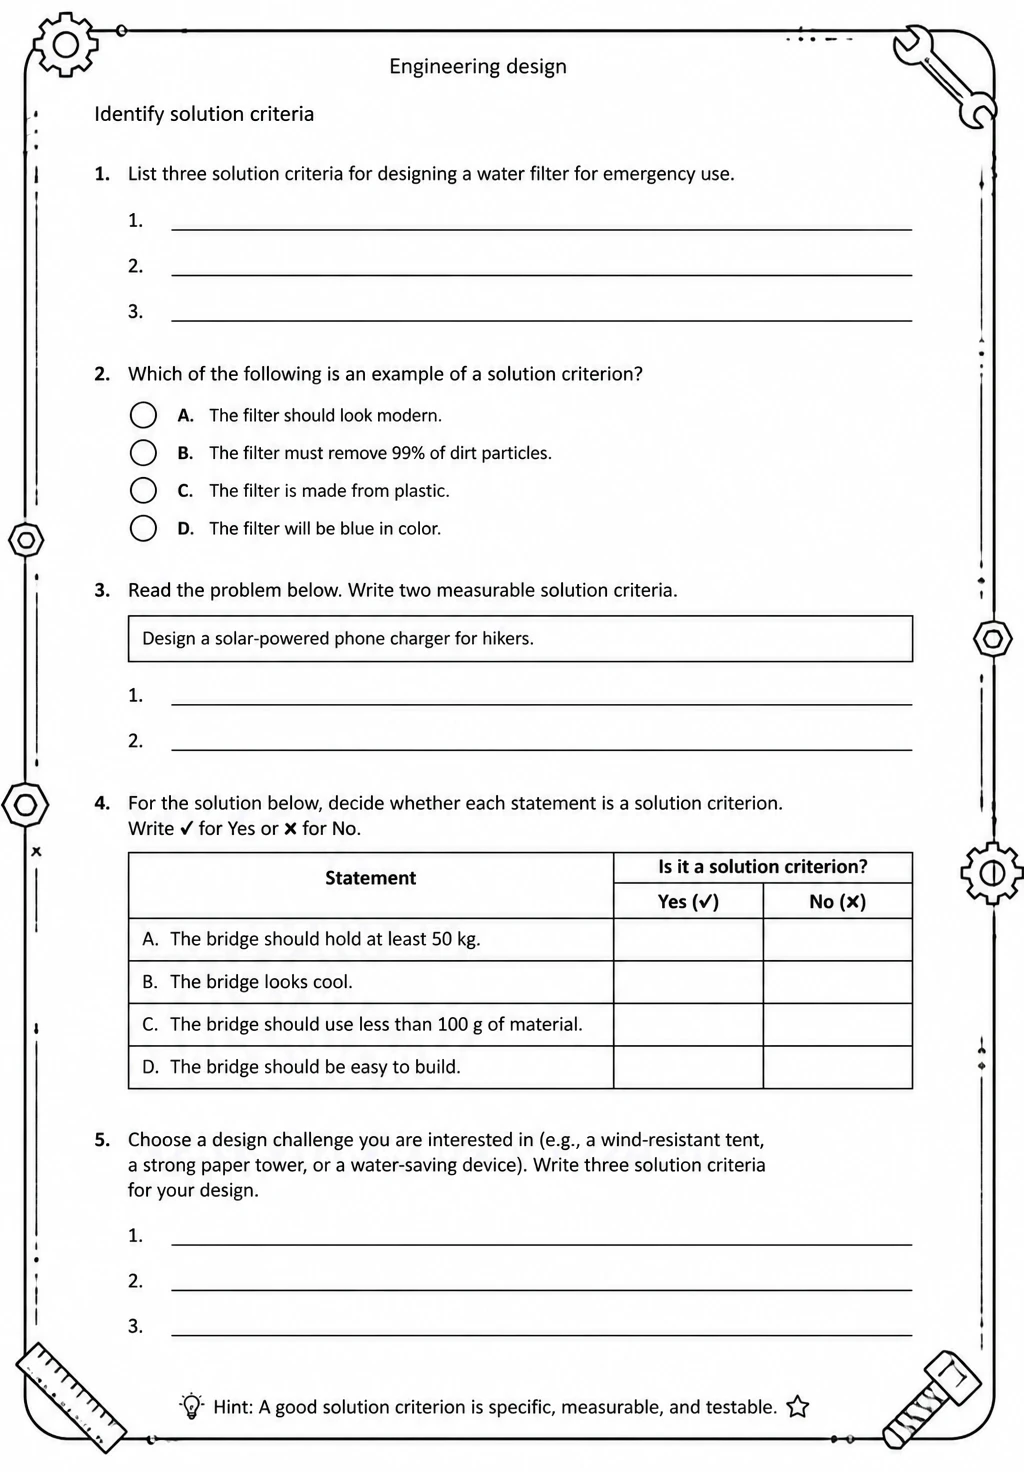
Identify solution criteria
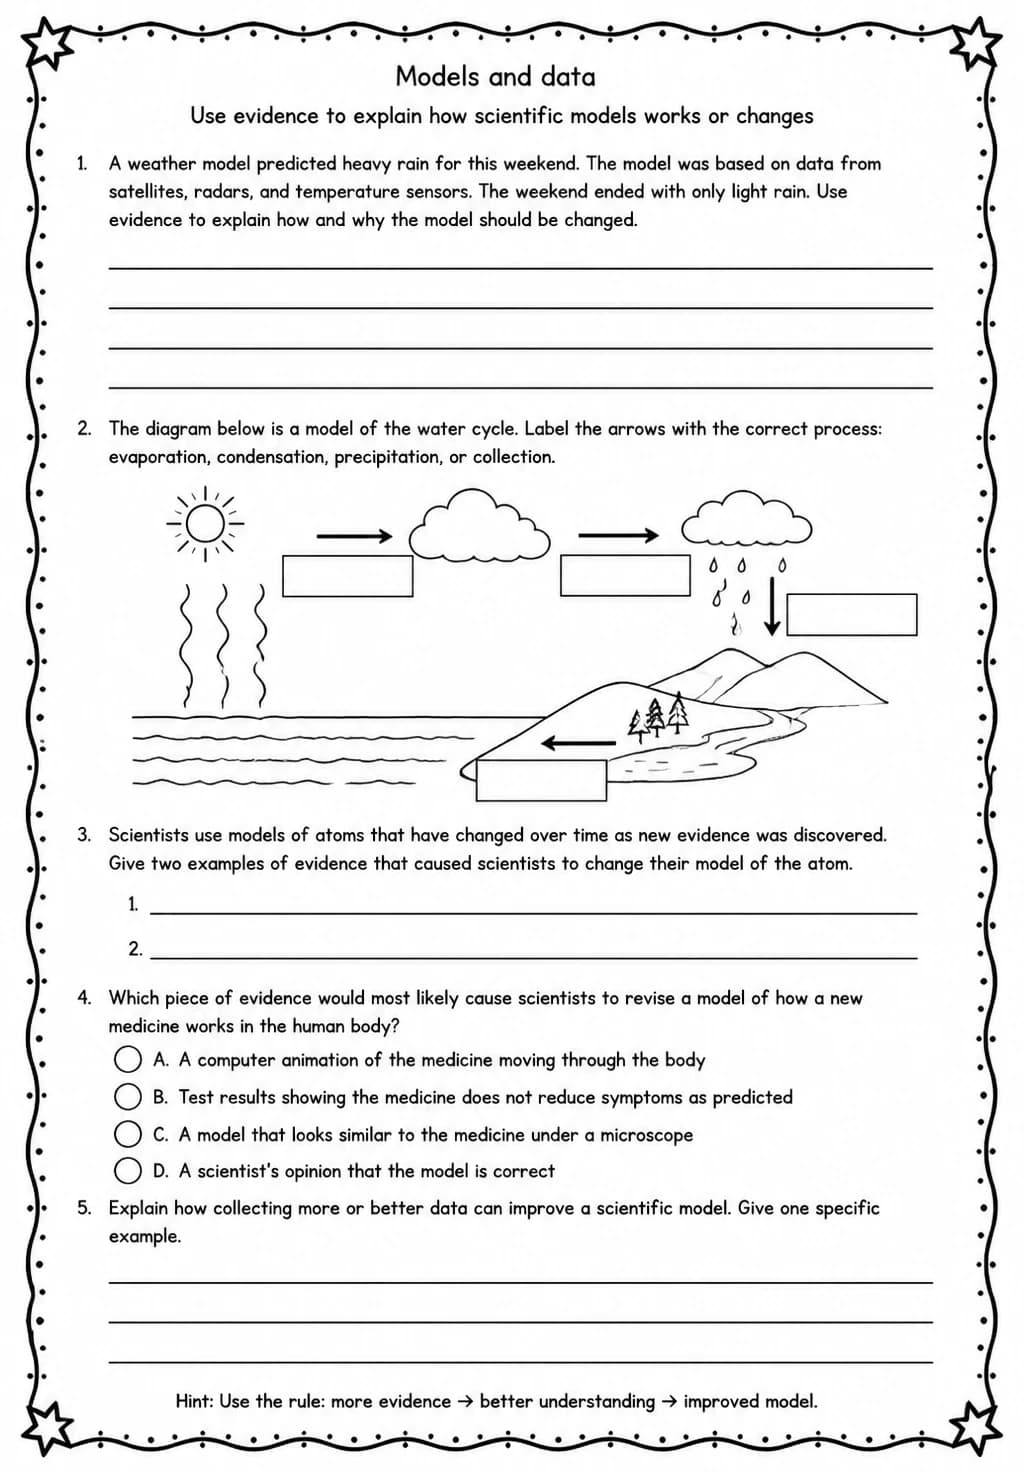
Use evidence to explain how scientific models works or changes
You might also like
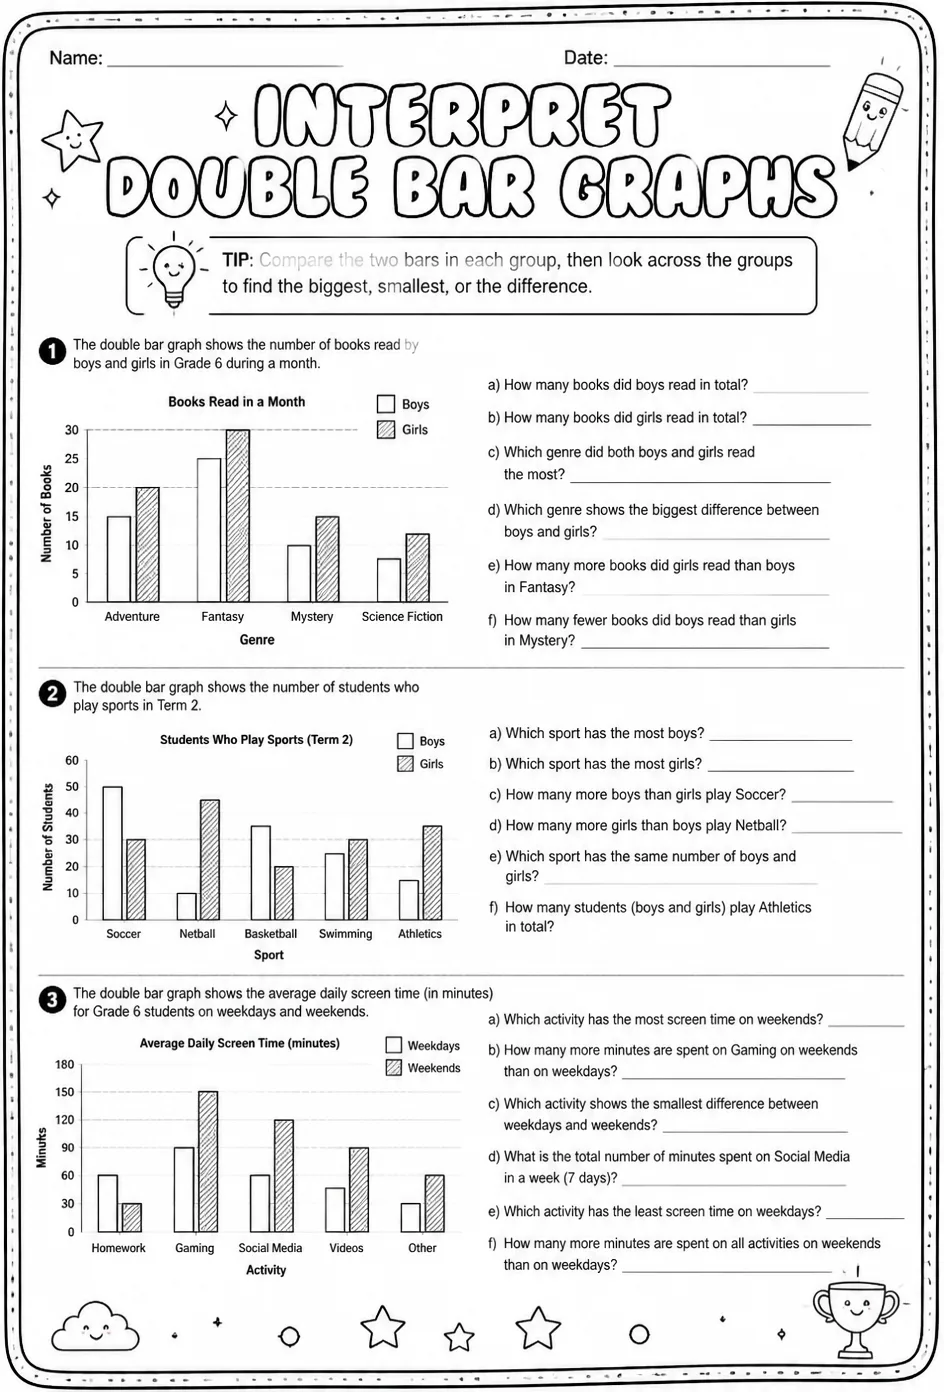
Interpret double bar graphs
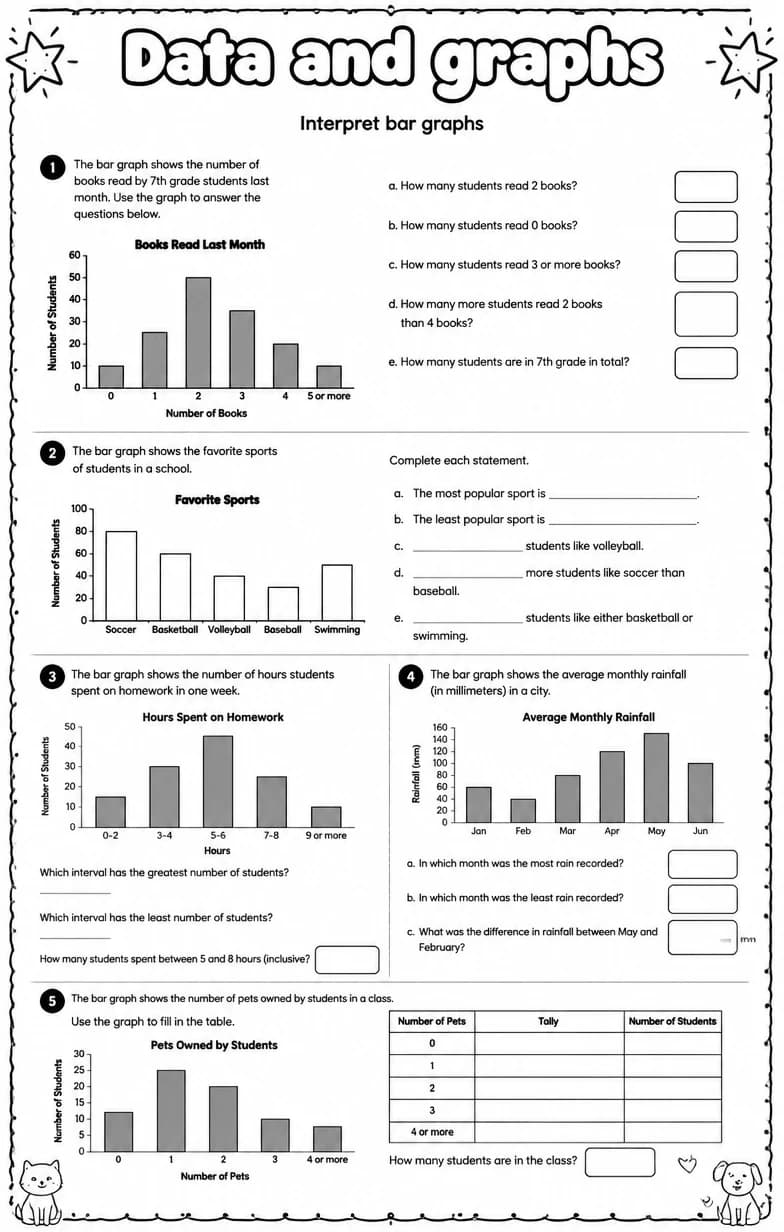
Interpret bar graphs

Interpret line graphs
Fractions Board Game — Middle School | Free Classroom Game
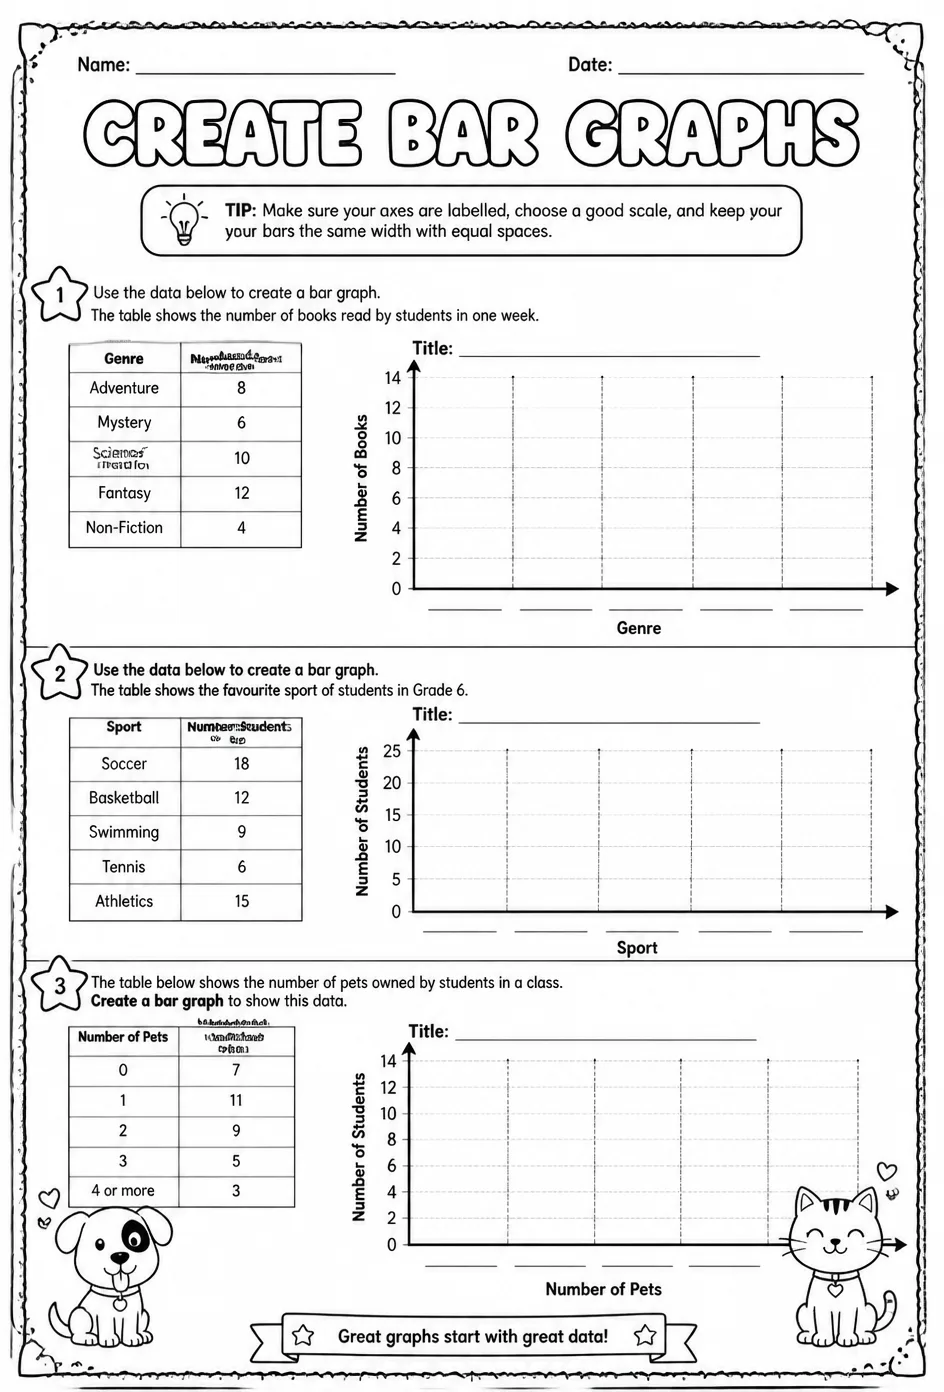
Create bar graphs
