Create scaled bar graphs
Free printable Grade 3 math worksheet for "Create scaled bar graphs" — practice data and graphs. No-prep, print or assign online.
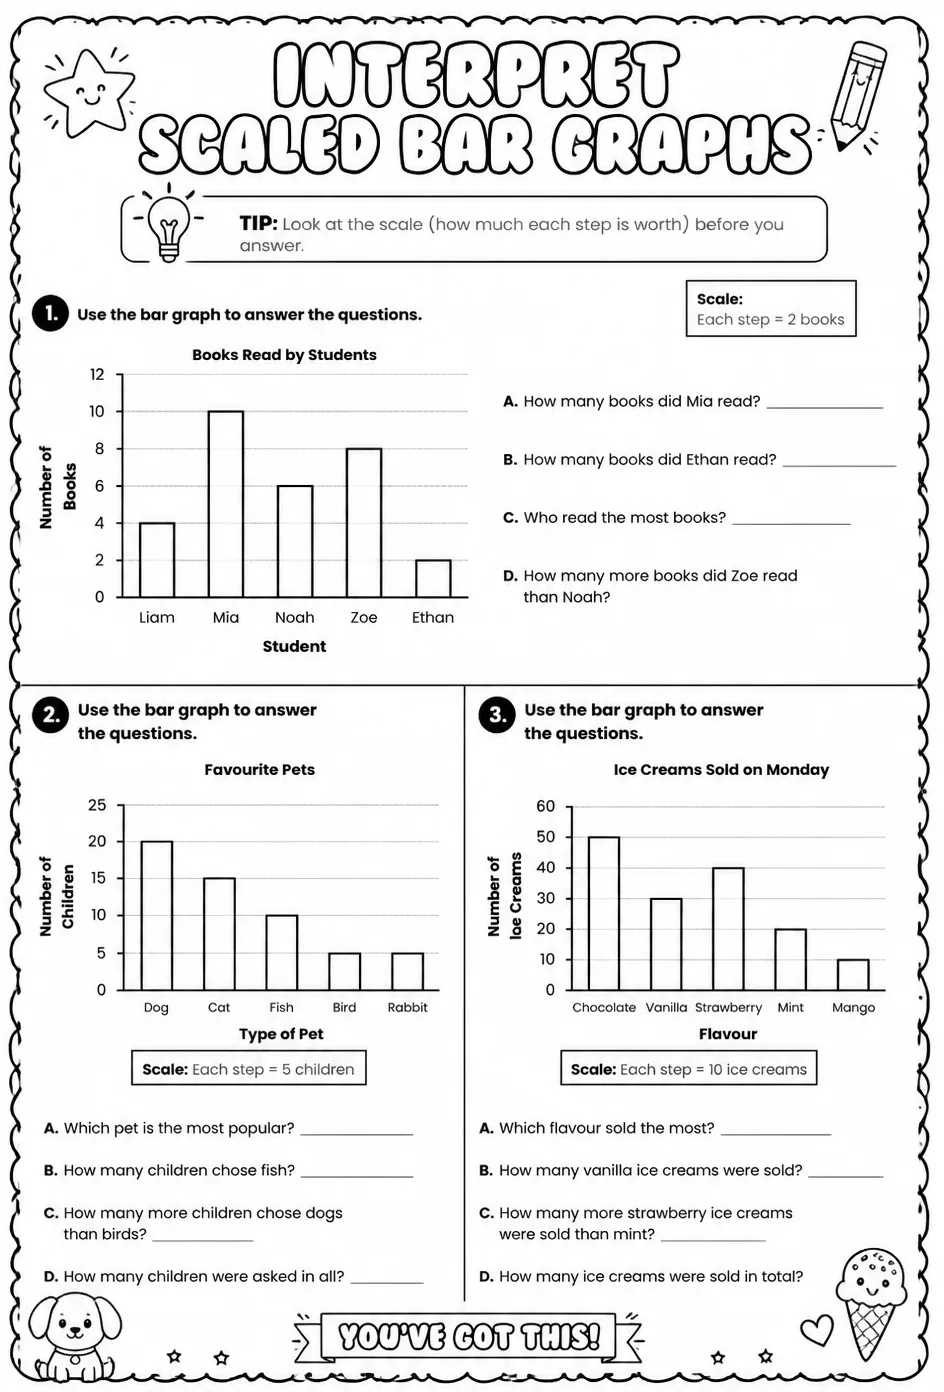
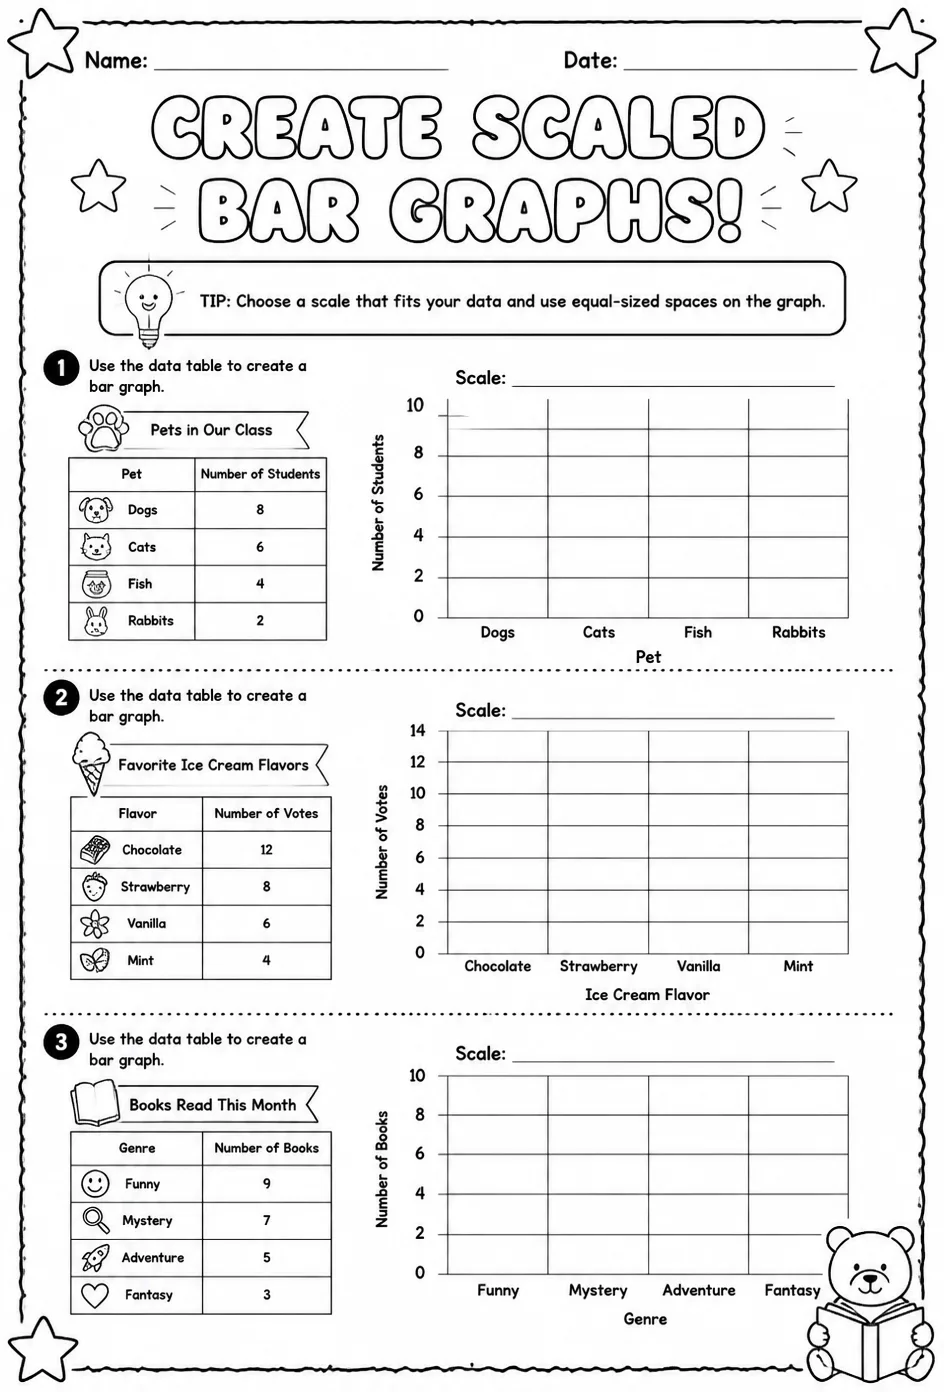
This worksheet guides students through creating scaled bar graphs based on provided data sets, reinforcing their understanding of data representation. Teachers can use it to support lessons on data interpretation and graphical skills in Grade 3 math. It provides practice in selecting suitable scales and accurately plotting data, enhancing students' ability to visualize and analyze information.
Learning objectives
- Interpret data to determine appropriate scales for bar graphs
- Construct scaled bar graphs accurately using given data sets
- Analyze bar graphs to answer questions about data trends and comparisons
How to use this worksheet
- Click “Download Worksheet” and sign in with Google or email to get the PDF instantly.
- Print at home or in class for Grade 3; it's no-prep, with no extra materials needed.
- Hand it out as classwork, homework, or a quick warm-up.
Frequently asked questions
Is the “Create scaled bar graphs” worksheet free?
Yes. “Create scaled bar graphs” is a free printable Math worksheet. Sign in with Google or email to download the PDF instantly.
What grade or age is this Math worksheet for?
It's designed for Grade 3 (ages 8–9), covering Data and graphs.
Do I need to prep anything?
No. It's a no-prep, print-and-go worksheet — just download and hand it out.
Create more worksheets in our Worksheet Studio
Generate fresh worksheets for any grade, topic, and language — free.
Open the Worksheet StudioMore for Grade 3

You might also like
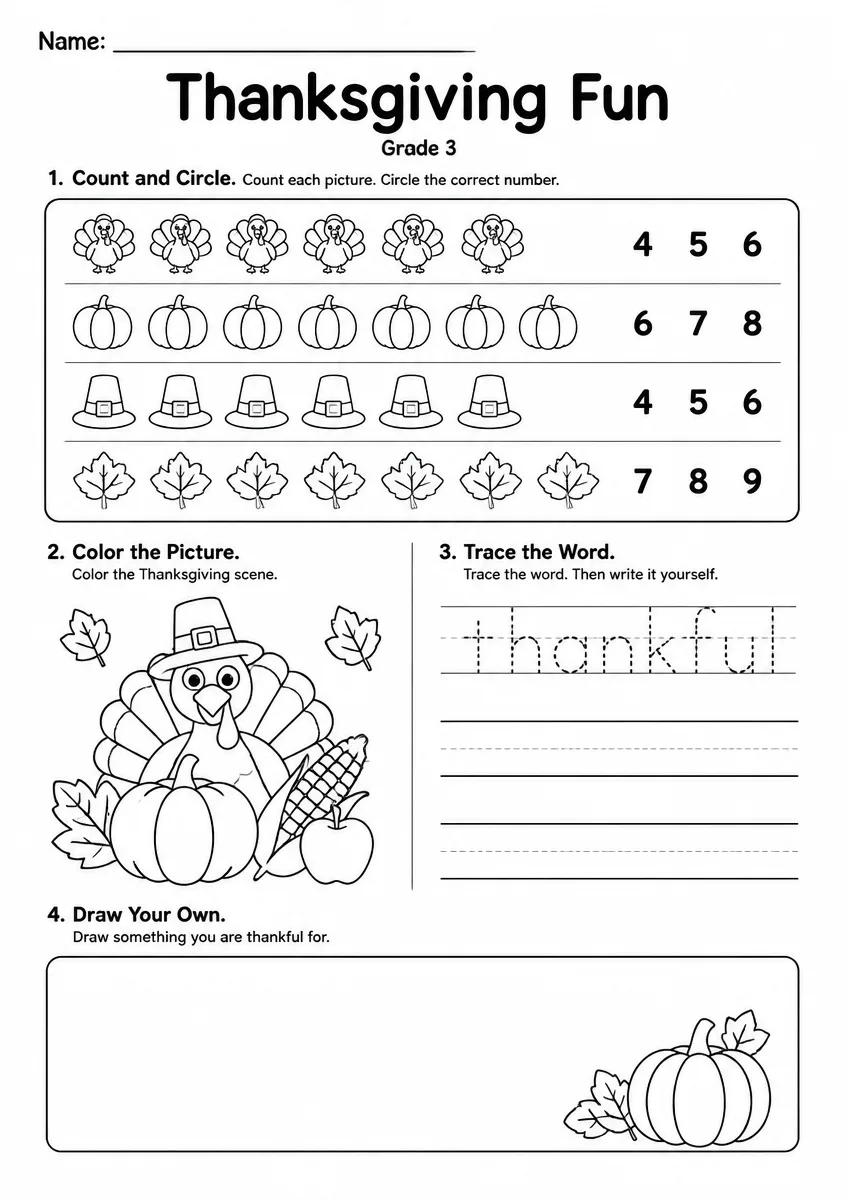
Thanksgiving Worksheet — Grade 3
Multiplication Facts Bingo — Grade 3 | Free Classroom Game
Fractions Bingo — Grade 3 | Free Classroom Game
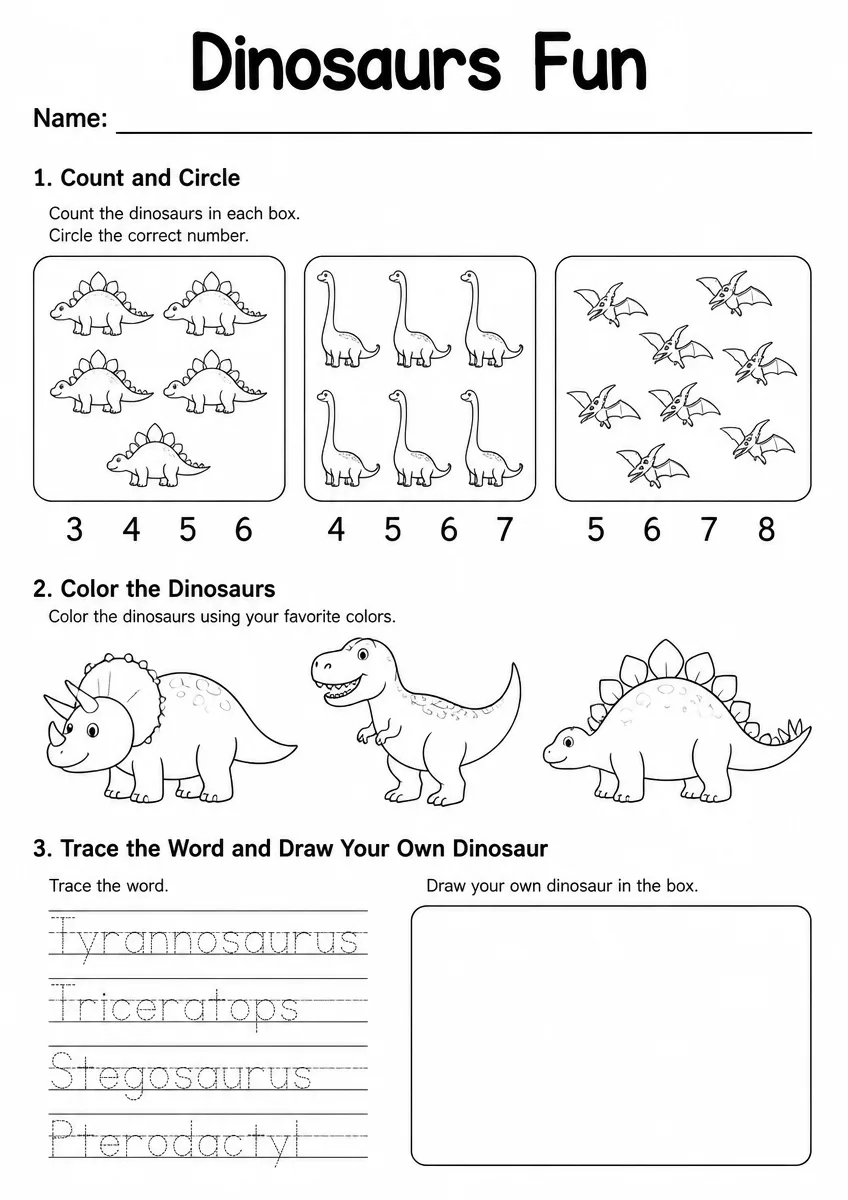
Dinosaurs Worksheet — Grade 3
Division Memory Match — Grade 3 | Free Classroom Game