Outliers in scatter plots
Free printable Precalculus math worksheet for "Outliers in scatter plots" — practice bivariate statistics. No-prep, print or assign online.
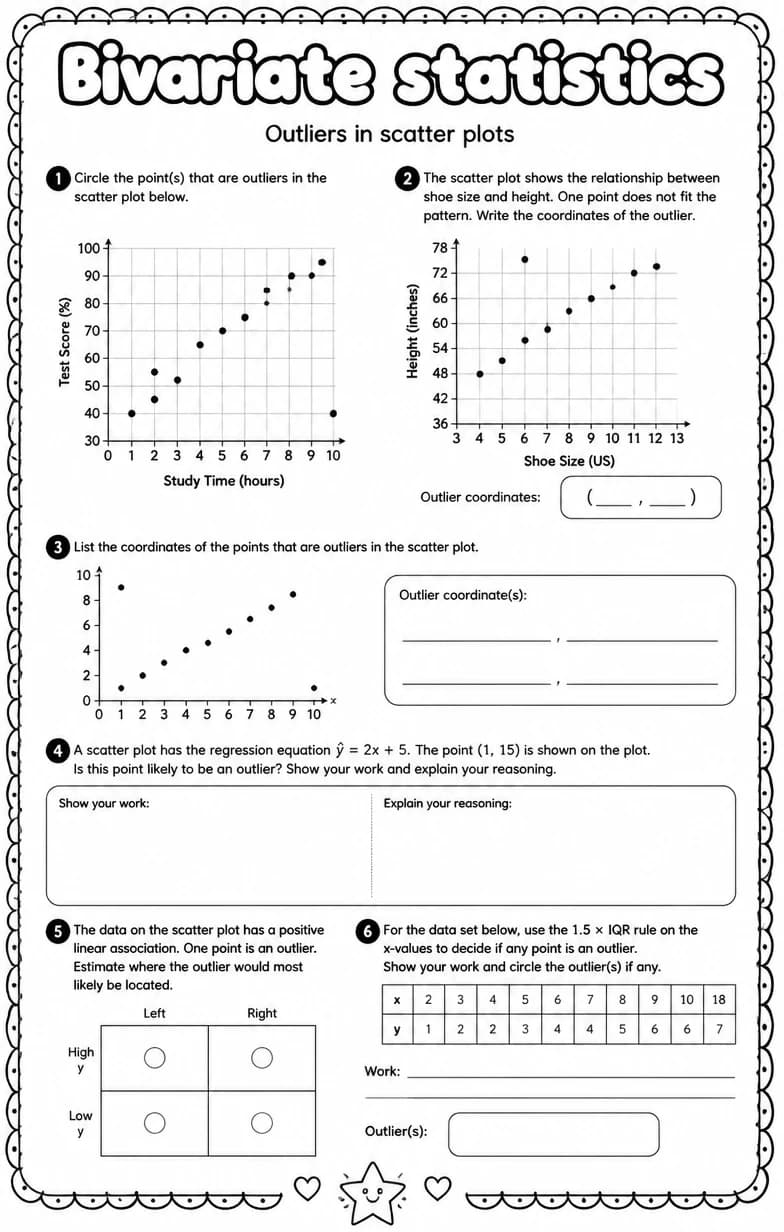
This worksheet focuses on recognizing and analyzing outliers in scatter plots within bivariate statistics. Teachers can use it to reinforce students' understanding of how outliers affect data interpretation, correlation strength, and regression analysis. It provides challenging problems designed to deepen high school precalculus students' skills in statistical reasoning and data analysis.
Learning objectives
- Identify outliers in scatter plots representing bivariate data
- Analyze the impact of outliers on correlation and regression lines
- Interpret the significance of outliers in the context of real-world data sets
How to use this worksheet
- Click “Download Worksheet” to get the PDF — free with a KiwiBee account (up to 25 downloads a month).
- Print at home or in class for High School; it's no-prep, with no extra materials needed.
- Hand it out as classwork, homework, or a quick warm-up.
Frequently asked questions
Is the “Outliers in scatter plots” worksheet free?
Yes. “Outliers in scatter plots” is a free printable Math worksheet. Sign in with a free KiwiBee account to download the PDF — it includes up to 25 downloads a month.
What grade or age is this Math worksheet for?
It's designed for High School (ages 14–18), covering Bivariate statistics.
Do I need to prep anything?
No. It's a no-prep, print-and-go worksheet — just download and hand it out.
Make it your own in the Worksheet Studio
Combine this with other worksheets, duplicate it, or generate a fresh version for any grade and language — free, no sign-up.
Open the Worksheet StudioMore for High School

You might also like