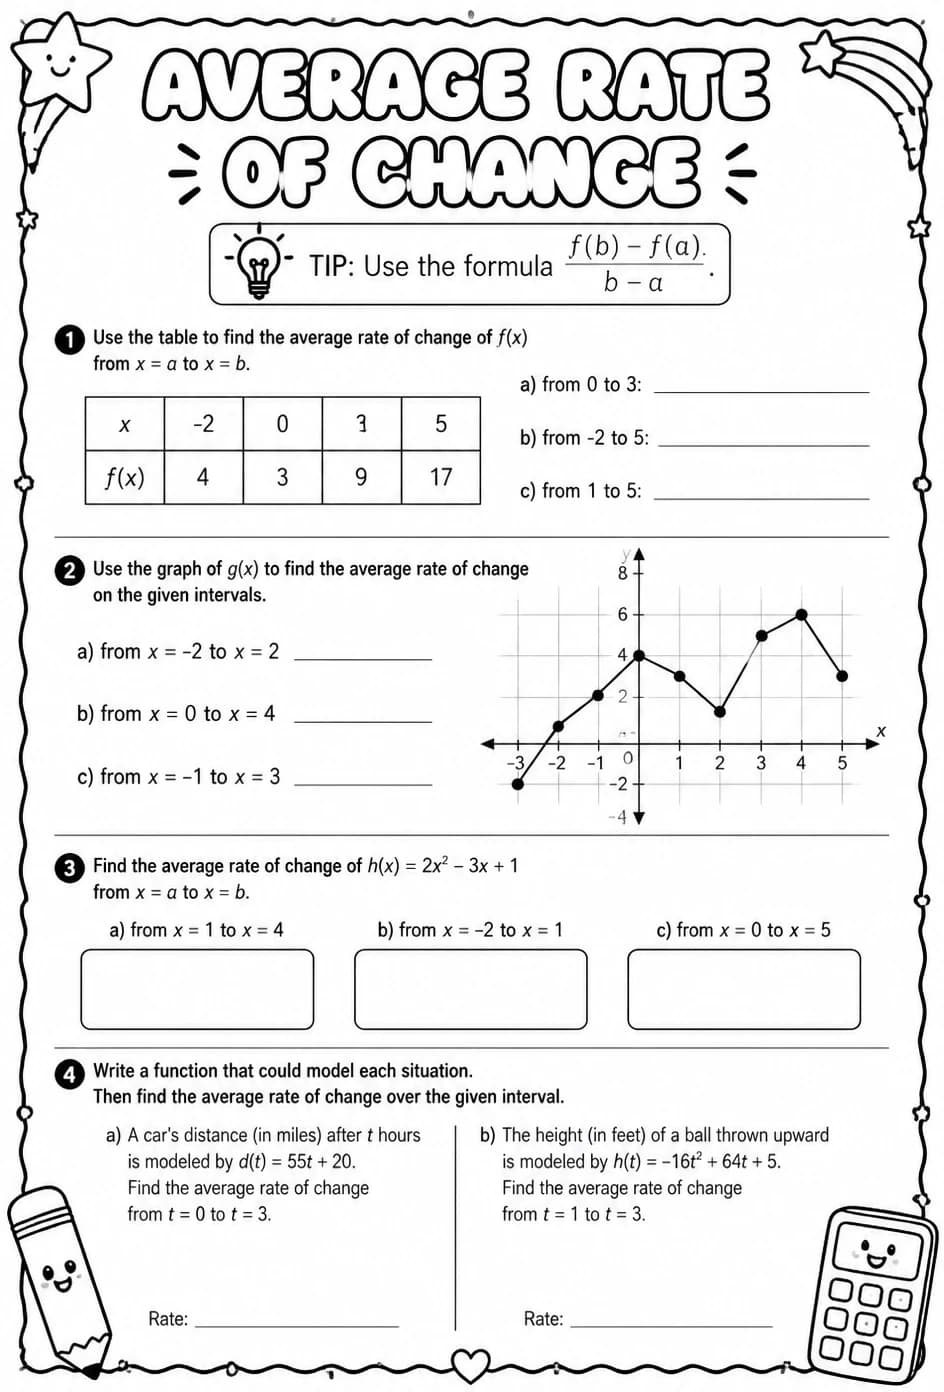
Estimate average rate of change from a graph
Free printable Integrated Math 1 math worksheet for "Estimate average rate of change from a graph" — practice linear functions. No-prep, print or assign online.
This worksheet challenges students to estimate the average rate of change from various linear function graphs. Teachers can use it to reinforce graph interpretation skills and deepen understanding of linear behavior in real contexts. Ideal for high school Integrated Math 1 classes focusing on linear functions and rate of change concepts.
Learning objectives
- Interpret graphs of linear functions to estimate the average rate of change over specified intervals
- Calculate approximate rates of change by analyzing changes in function values from a graph
- Apply understanding of linear functions to solve real-world problems involving average rate of change
How to use this worksheet
- Click “Download Worksheet” to get the PDF — free with a KiwiBee account (up to 25 downloads a month).
- Print at home or in class for High School; it's no-prep, with no extra materials needed.
- Hand it out as classwork, homework, or a quick warm-up.
Frequently asked questions
Is the “Estimate average rate of change from a graph” worksheet free?
Yes. “Estimate average rate of change from a graph” is a free printable Math worksheet. Sign in with a free KiwiBee account to download the PDF — it includes up to 25 downloads a month.
What grade or age is this Math worksheet for?
It's designed for High School (ages 14–18), covering Linear functions.
Do I need to prep anything?
No. It's a no-prep, print-and-go worksheet — just download and hand it out.
Make it your own in the Worksheet Studio
Combine this with other worksheets, duplicate it, or generate a fresh version for any grade and language — free, no sign-up.
Open the Worksheet Studio