Box plots
Free printable Integrated Math 1 math worksheet for "Box plots" — practice statistics. No-prep, print or assign online.
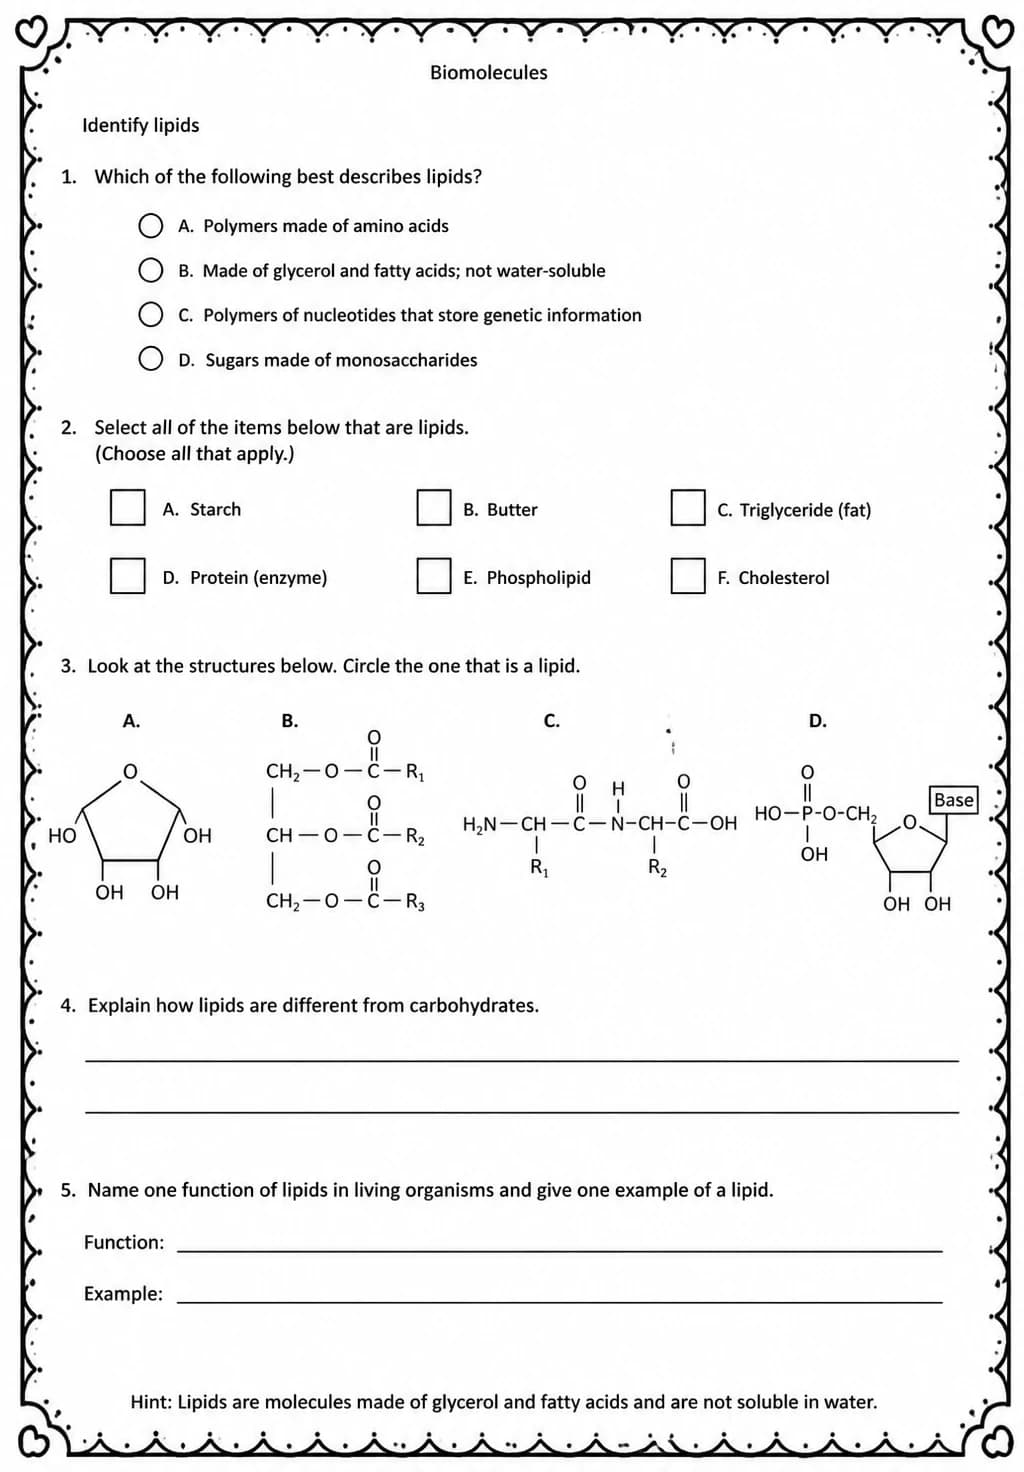
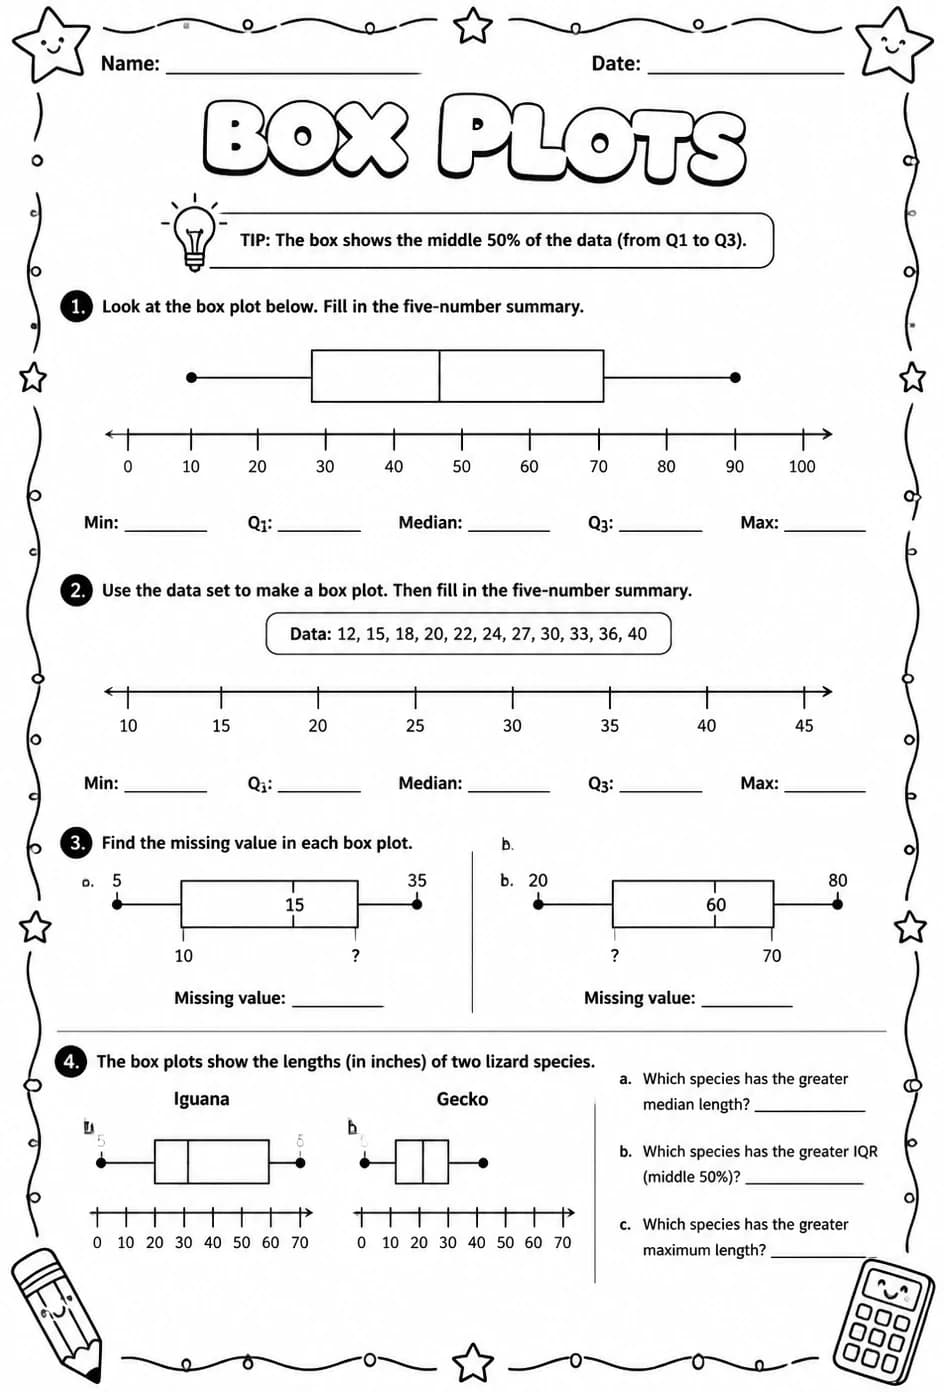
This worksheet provides high school students with challenging practice on box plots within the Integrated Math 1 statistics curriculum. Teachers can use these problems to reinforce concepts of data distribution, quartiles, and outlier detection through hands-on graphing and analysis. The exercises promote critical thinking and help students master interpreting and creating box plots for diverse data sets.
Learning objectives
- Interpret data distributions using box plots to identify medians, quartiles, and outliers
- Construct box plots from raw data sets to visually represent statistical summaries
- Analyze and compare multiple box plots to draw conclusions about data variability and central tendency
How to use this worksheet
- Click “Download Worksheet” to get the PDF — free with a KiwiBee account (up to 25 downloads a month).
- Print at home or in class for High School; it's no-prep, with no extra materials needed.
- Hand it out as classwork, homework, or a quick warm-up.
Frequently asked questions
Is the “Box plots” worksheet free?
Yes. “Box plots” is a free printable Math worksheet. Sign in with a free KiwiBee account to download the PDF — it includes up to 25 downloads a month.
What grade or age is this Math worksheet for?
It's designed for High School (ages 14–18), covering Statistics.
Do I need to prep anything?
No. It's a no-prep, print-and-go worksheet — just download and hand it out.
Make it your own in the Worksheet Studio
Combine this with other worksheets, duplicate it, or generate a fresh version for any grade and language — free, no sign-up.
Open the Worksheet Studio