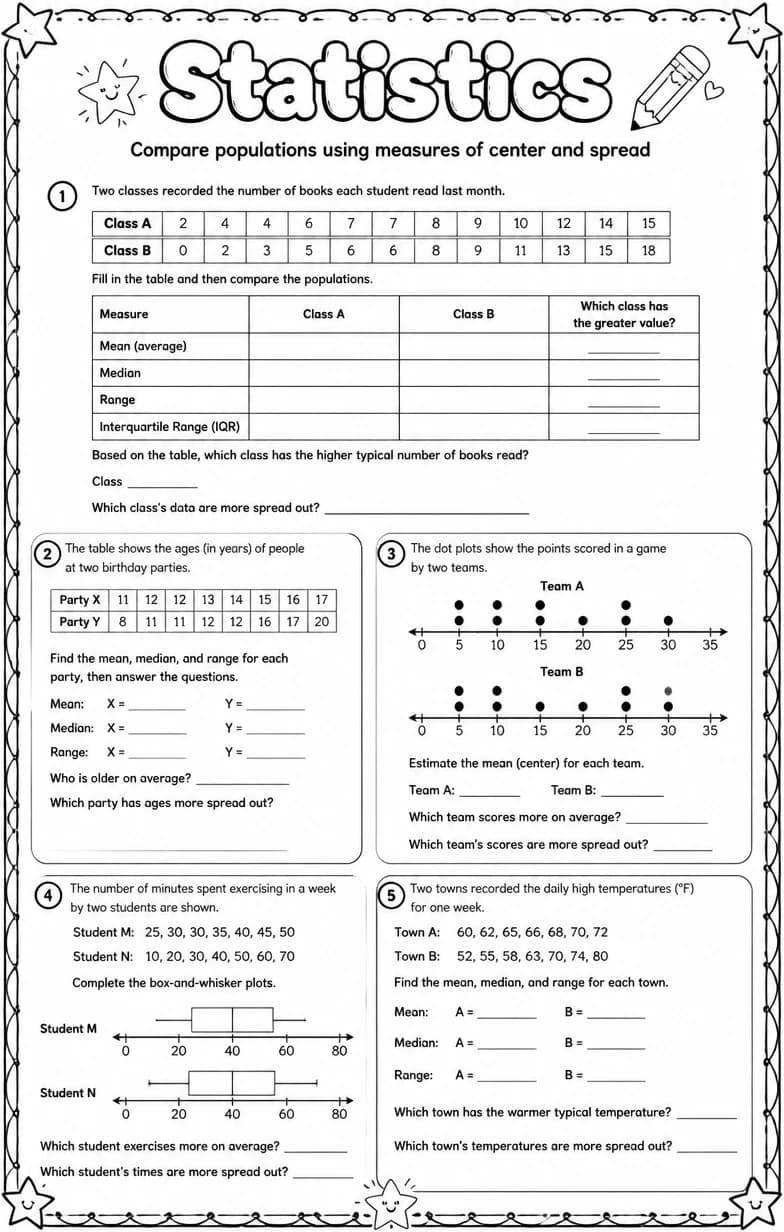
Compare populations using measures of center and spread
Free printable Grade 7 math worksheet for "Compare populations using measures of center and spread" — practice statistics. No-prep, print or assign online.
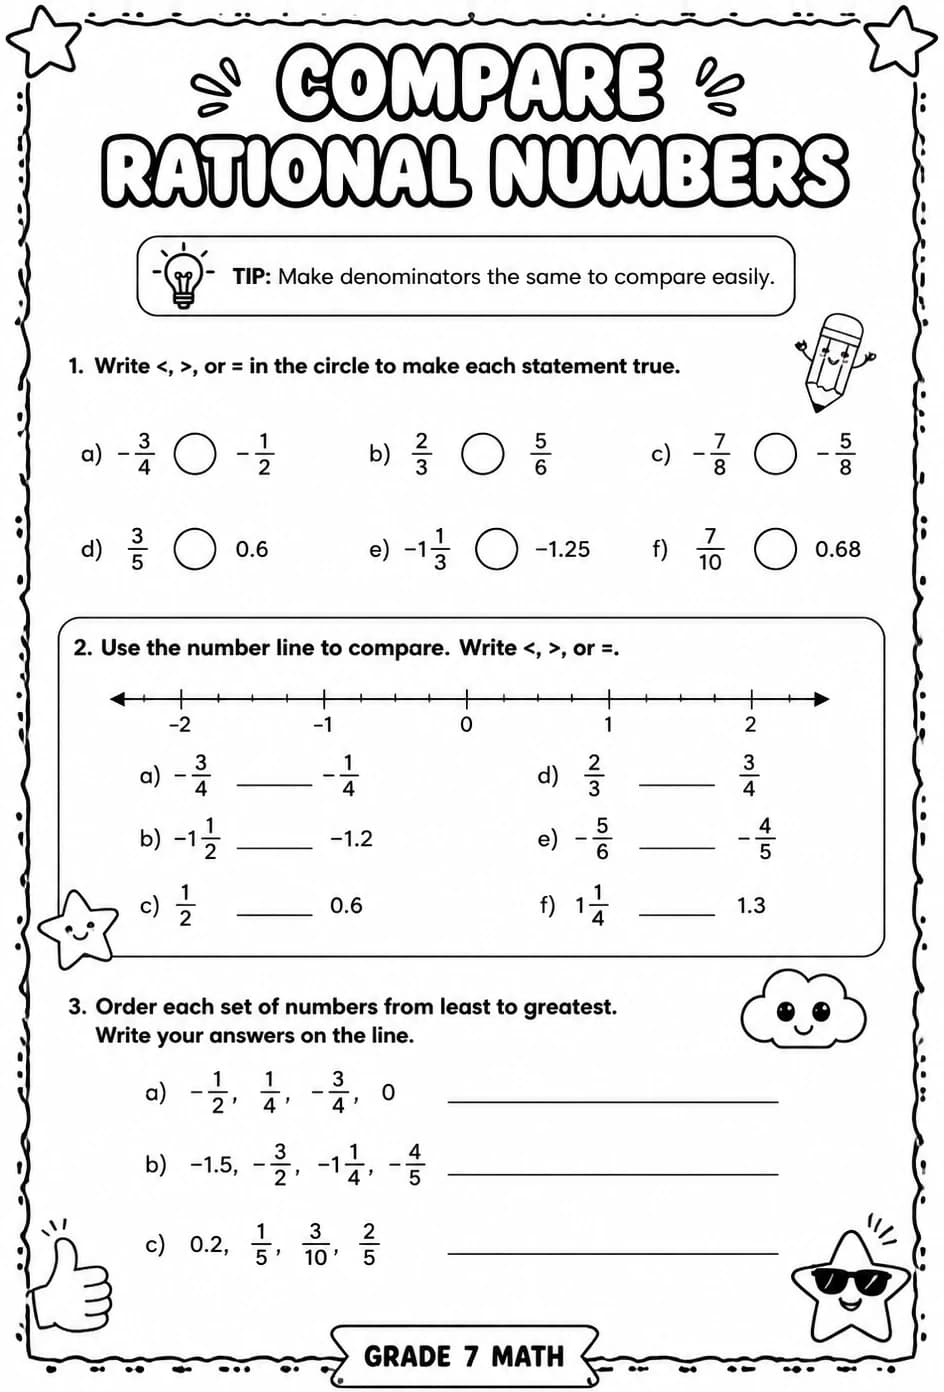
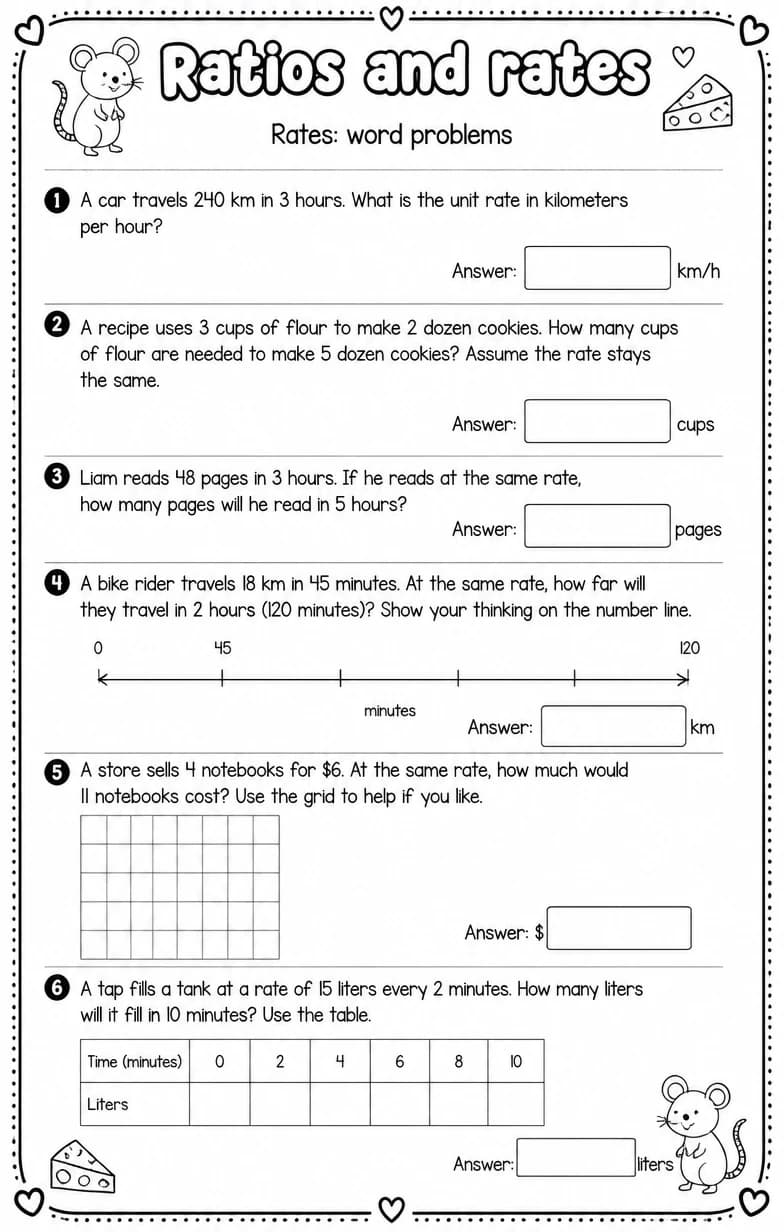
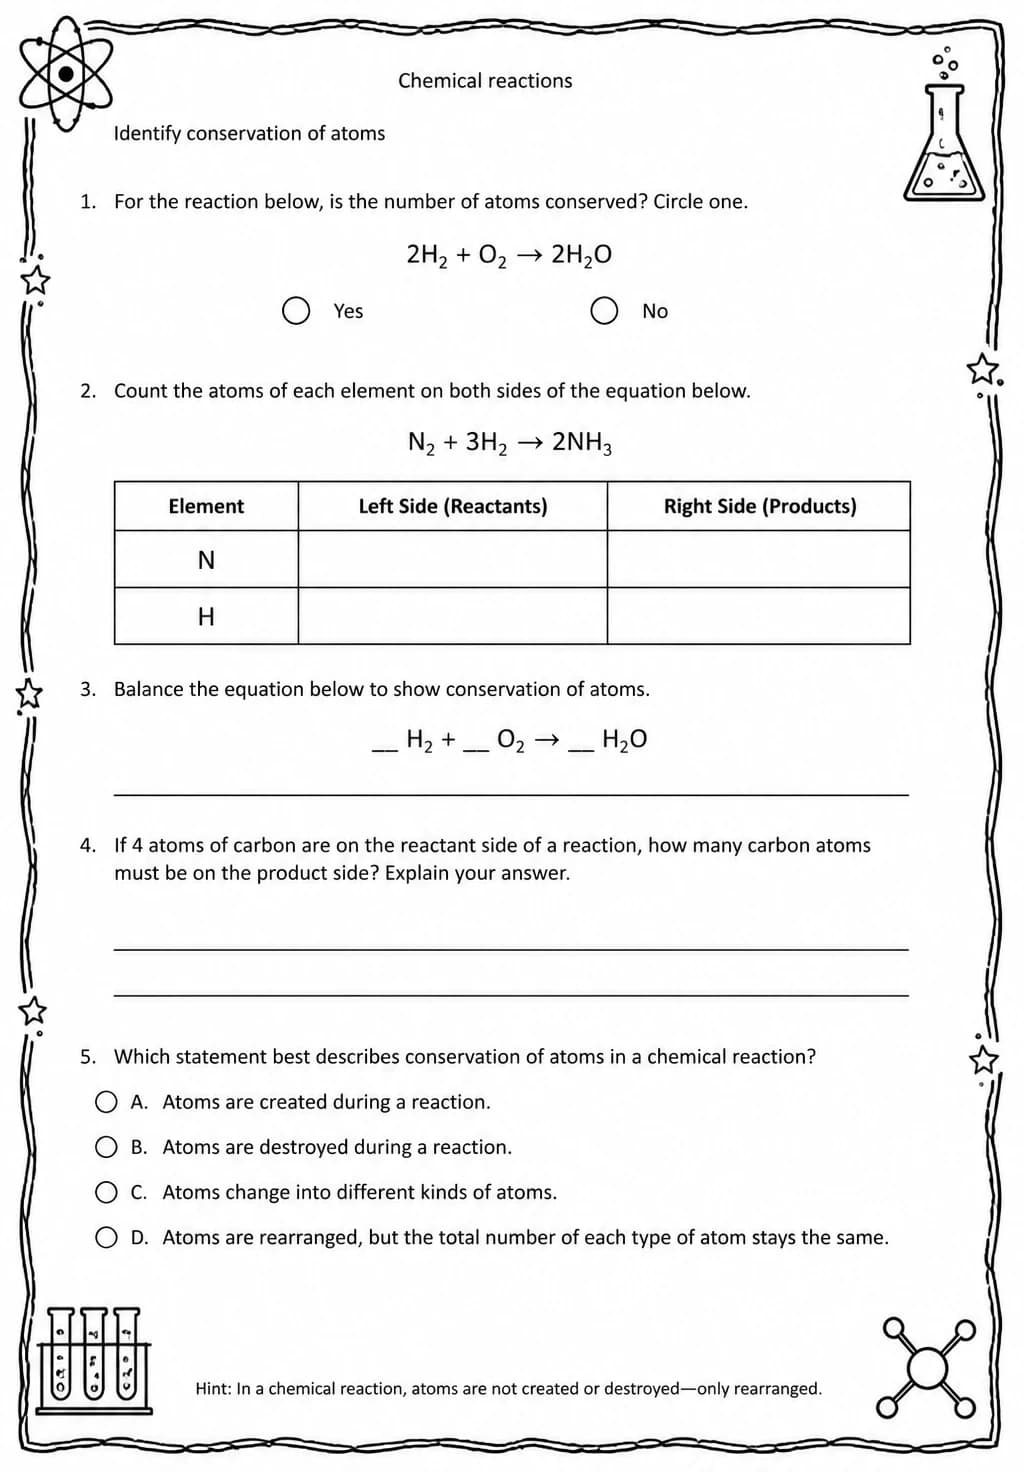
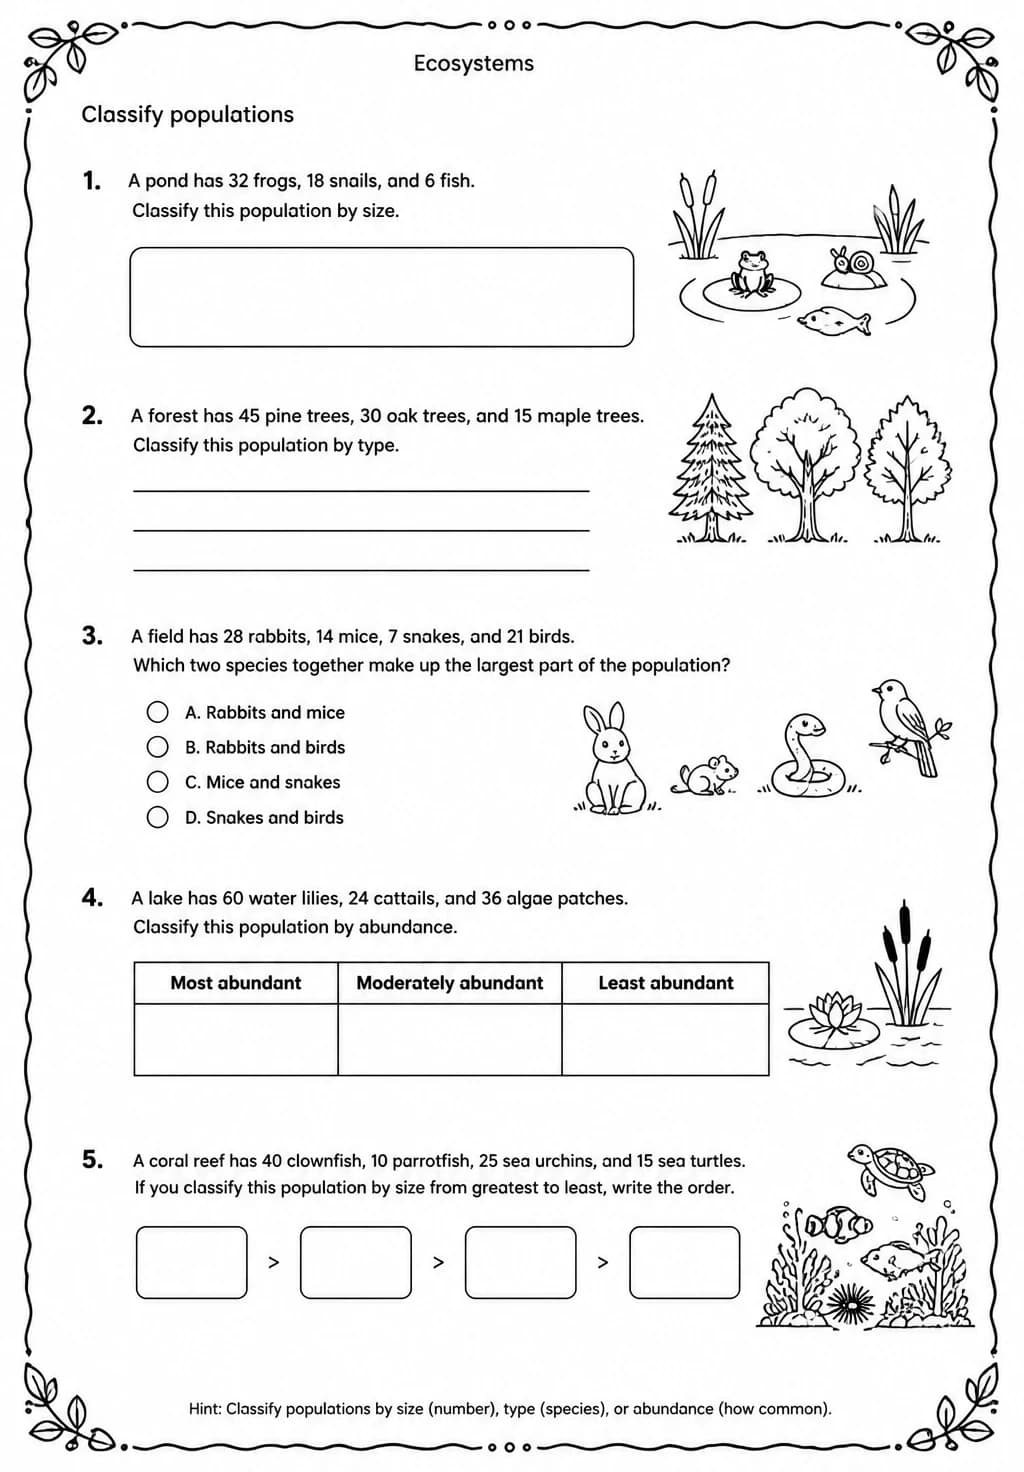
This worksheet provides middle school students with practice in comparing populations using key statistical measures of center and spread. Teachers can use it to reinforce concepts in data analysis, helping students understand how to interpret and contrast different data sets effectively. Ideal for Grade 7 statistics lessons, it supports skill development in analyzing variability and central tendency in real-world contexts.
Learning objectives
- Analyze and interpret measures of center (mean, median, mode) to compare different populations.
- Calculate and compare measures of spread (range, interquartile range, standard deviation) for given data sets.
- Evaluate population data to draw conclusions about variability and central tendency.
Answer Key
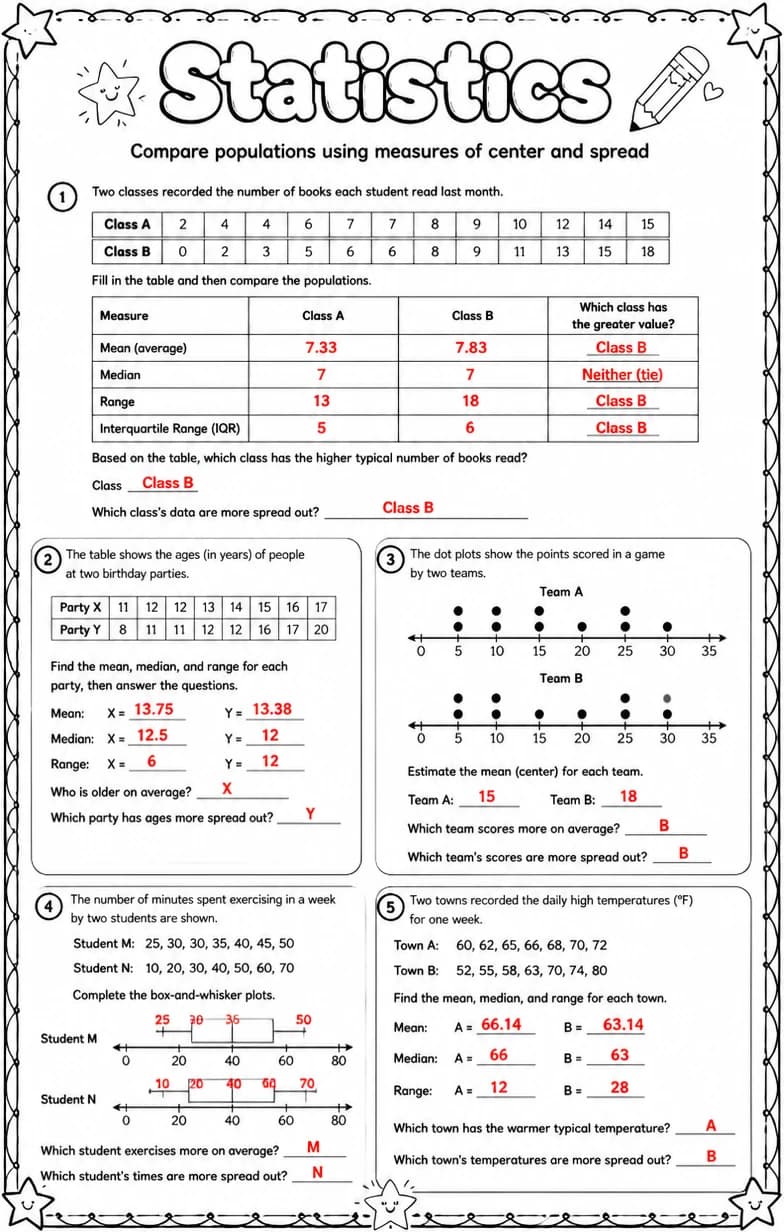
How to use this worksheet
- Click “Download Worksheet” to get the PDF — free with a KiwiBee account (up to 50 downloads a month).
- Print at home or in class for Middle School; it's no-prep, with no extra materials needed.
- Use the included answer key to mark it in seconds.
Frequently asked questions
Is the “Compare populations using measures of center and spread” worksheet free?
Yes. “Compare populations using measures of center and spread” is a free printable Math worksheet. Sign in with a free KiwiBee account to download the PDF — it includes up to 50 downloads a month.
What grade or age is this Math worksheet for?
It's designed for Middle School (ages 11–14), covering Statistics.
Does it come with an answer key?
Yes — a matching answer key is included so you can grade it in seconds.
Make it your own in the Worksheet Studio
Combine this with other worksheets, duplicate it, or generate a fresh version for any grade and language — free, no sign-up.
Open the Worksheet Studio