Interpret tally charts
Free printable Grade 2 math worksheet for "Interpret tally charts" — practice data and graphs. No-prep, print or assign online.
This worksheet helps Grade 2 students develop skills in interpreting tally charts within the topic of data and graphs. Teachers can use this resource to reinforce students' ability to read and analyze tally marks, enhancing their understanding of organizing and representing data visually. The exercises include both reading existing tally charts and creating new ones, supporting medium-level practice in data interpretation.
Learning objectives
- Read and interpret data presented in tally charts
- Answer questions based on information from tally charts
- Create simple tally charts from given data sets
How to use this worksheet
- Click “Download Worksheet” and sign in with Google or email to get the PDF instantly.
- Print at home or in class for Grade 2; it's no-prep, with no extra materials needed.
- Hand it out as classwork, homework, or a quick warm-up.
Frequently asked questions
Is the “Interpret tally charts” worksheet free?
Yes. “Interpret tally charts” is a free printable Math worksheet. Sign in with Google or email to download the PDF instantly.
What grade or age is this Math worksheet for?
It's designed for Grade 2 (ages 7–8), covering Data and graphs.
Do I need to prep anything?
No. It's a no-prep, print-and-go worksheet — just download and hand it out.
Create more worksheets in our Worksheet Studio
Generate fresh worksheets for any grade, topic, and language — free.
Open the Worksheet StudioMore for Grade 2


You might also like
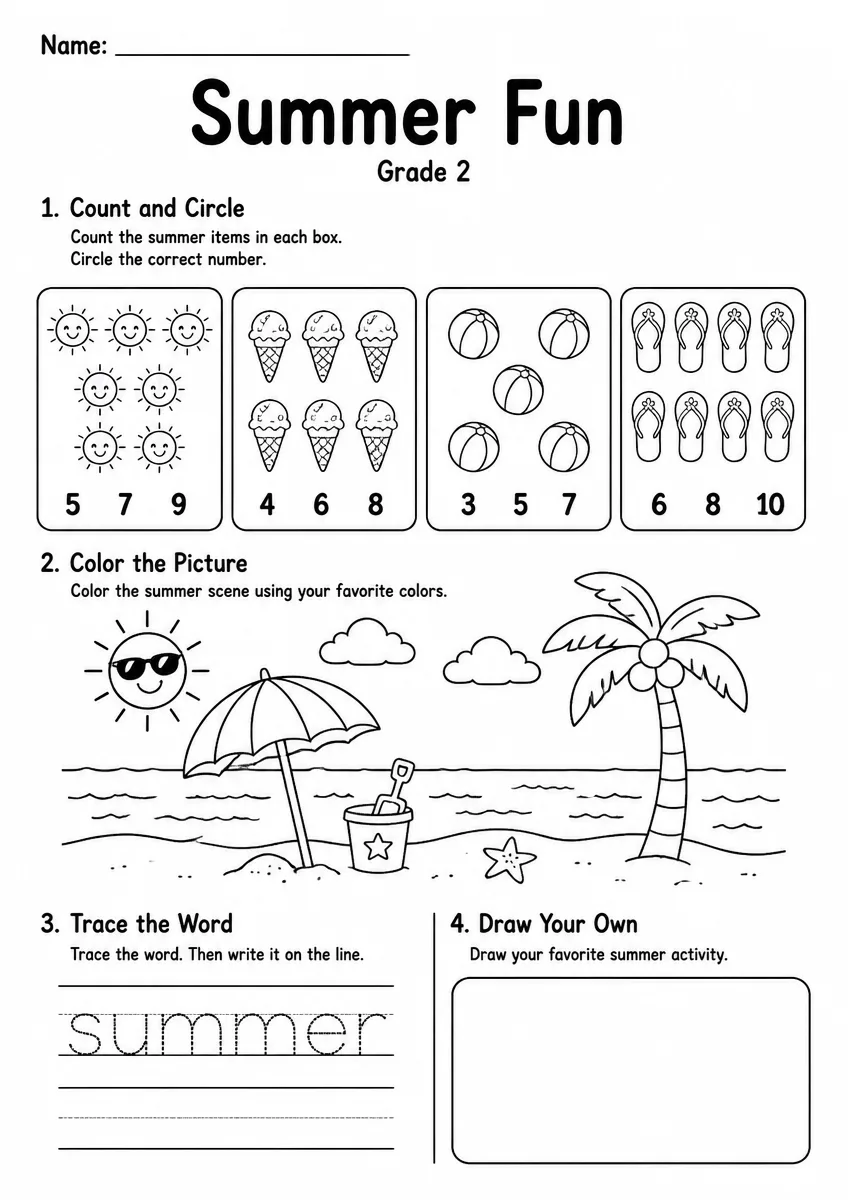
Summer Worksheet — Grade 2

Summer Counting Coloring Page
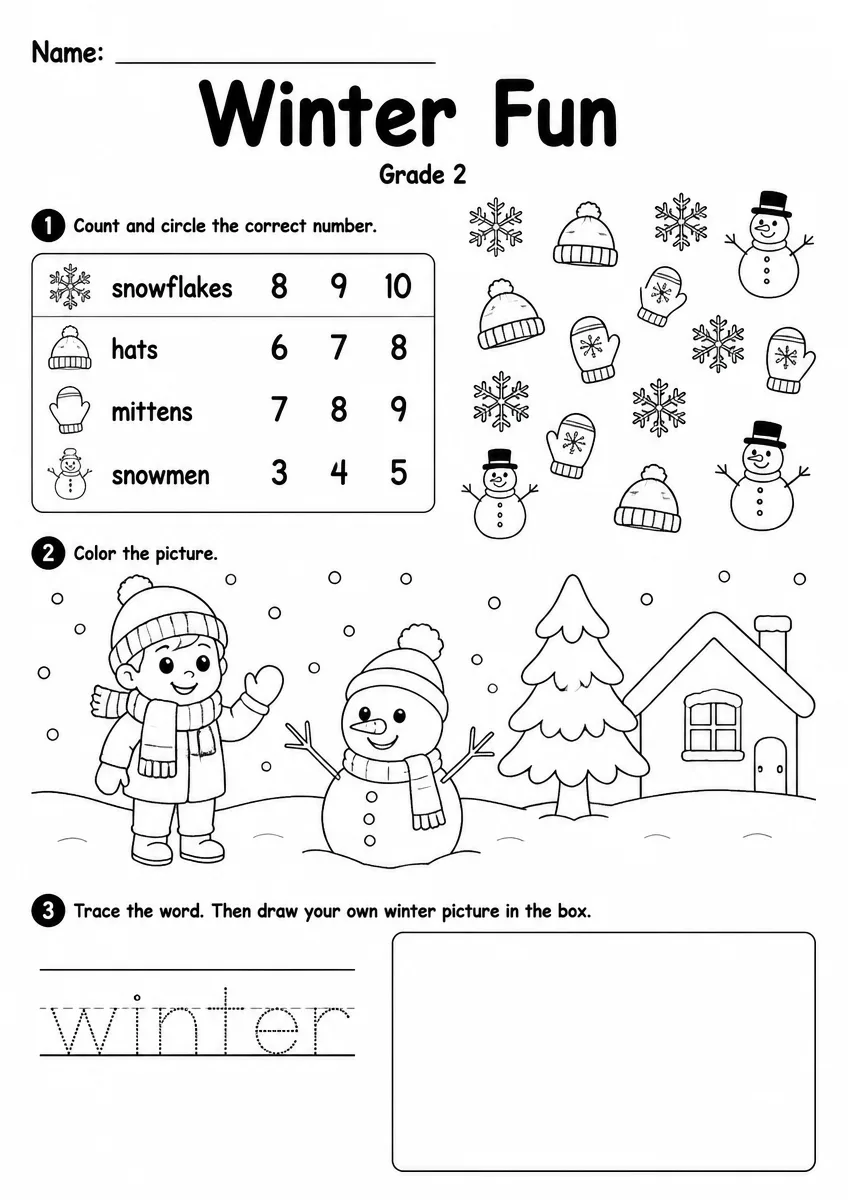
Winter Worksheet — Grade 2

Earth Day Shapes Coloring Page

Winter Counting Coloring Page